29
/
en
AIzaSyAYiBZKx7MnpbEhh9jyipgxe19OcubqV5w
April 1, 2024
35156
Heavily indebted poor countries (HIPC)
HPC
false
2
1
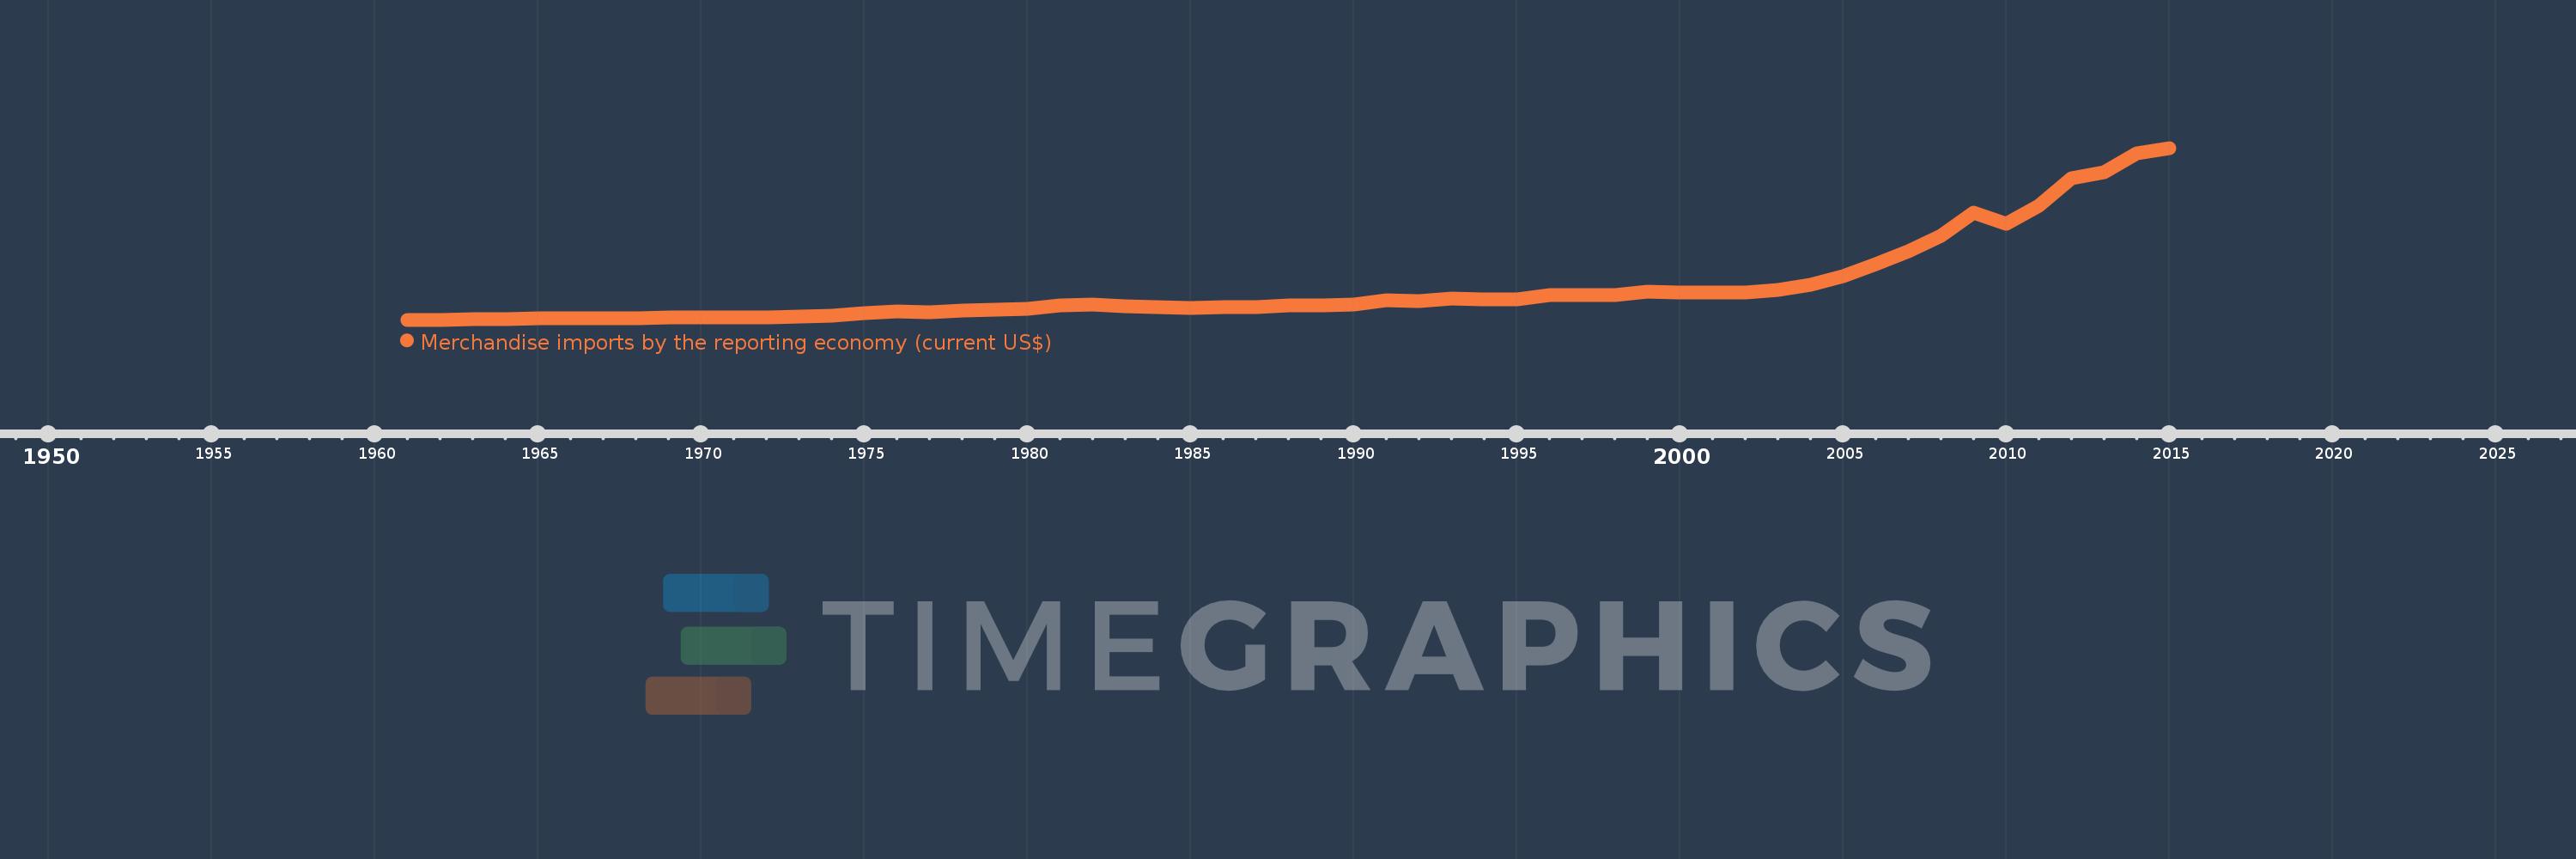
Merchandise imports by the reporting economy (current US$)
2015,2014,2013,2012,2011,2010,2009,2008,2007,2006,2005,2004,2003,2002,2001,2000,1999,1998,1997,1996,1995,1994,1993,1992,1991,1990,1989,1988,1987,1986,1985,1984,1983,1982,1981,1980,1979,1978,1977,1976,1975,1974,1973,1972,1971,1970,1969,1968,1967,1966,1965,1964,1963,1962,1961
This statistics in other country:
AfghanistanAlbaniaAlgeriaAmerican SamoaAngolaAntigua and BarbudaArab WorldArgentinaArmeniaArubaAustraliaAustriaAzerbaijanBahamas, TheBahrainBangladeshBarbadosBelarusBelgiumBelizeBeninBermudaBoliviaBosnia and HerzegovinaBrazilBrunei DarussalamBulgariaBurkina FasoBurundiCabo VerdeCambodiaCameroonCanadaCaribbean small statesCentral African RepublicCentral Europe and the BalticsChadChileChinaColombiaComorosCongo, Dem. Rep.Congo, Rep.Costa RicaCote d'IvoireCroatiaCubaCyprusCzech RepublicDenmarkDjiboutiDominicaDominican RepublicEarly-demographic dividendEast Asia & PacificEast Asia & Pacific (excluding high income)East Asia & Pacific (IDA & IBRD countries)EcuadorEgypt, Arab Rep.El SalvadorEquatorial GuineaEstoniaEthiopiaEuro areaEurope & Central AsiaEurope & Central Asia (excluding high income)Europe & Central Asia (IDA & IBRD countries)European UnionFaroe IslandsFijiFinlandFragile and conflict affected situationsFranceFrench PolynesiaGabonGambia, TheGeorgiaGermanyGhanaGibraltarGreeceGreenlandGrenadaGuamGuatemalaGuineaGuinea-BissauGuyanaHaitiHeavily indebted poor countries (HIPC)High incomeHondurasHong Kong SAR, ChinaHungaryIBRD onlyIcelandIDA & IBRD totalIDA blendIDA onlyIDA totalIndiaIndonesiaIran, Islamic Rep.IraqIrelandIsraelItalyJamaicaJapanJordanKazakhstanKenyaKiribatiKorea, Dem. People’s Rep.Korea, Rep.KosovoKuwaitKyrgyz RepublicLao PDRLate-demographic dividendLatin America & Caribbean Latin America & Caribbean (excluding high income)Latin America & the Caribbean (IDA & IBRD countries)LatviaLeast developed countries: UN classificationLebanonLiberiaLibyaLithuaniaLow & middle incomeLow incomeLower middle incomeLuxembourgMacao SAR, ChinaMacedonia, FYRMadagascarMalawiMalaysiaMaldivesMaliMaltaMauritaniaMauritiusMexicoMiddle East & North AfricaMiddle East & North Africa (excluding high income)Middle East & North Africa (IDA & IBRD countries)Middle incomeMoldovaMongoliaMontenegroMoroccoMozambiqueMyanmarNauruNepalNetherlandsNew CaledoniaNew ZealandNicaraguaNigerNigeriaNorth AmericaNorwayOECD membersOmanOther small statesPacific island small statesPakistanPanamaPapua New GuineaParaguayPeruPhilippinesPolandPortugalPost-demographic dividendPre-demographic dividendQatarRomaniaRussian FederationRwandaSamoaSao Tome and PrincipeSaudi ArabiaSenegalSerbiaSeychellesSierra LeoneSingaporeSlovak RepublicSloveniaSmall statesSolomon IslandsSomaliaSouth AfricaSouth AsiaSouth Asia (IDA & IBRD)SpainSri LankaSt. Kitts and NevisSt. LuciaSt. Vincent and the GrenadinesSub-Saharan Africa Sub-Saharan Africa (excluding high income)Sub-Saharan Africa (IDA & IBRD countries)SudanSurinameSwedenSwitzerlandSyrian Arab RepublicTajikistanTanzaniaThailandTogoTongaTrinidad and TobagoTunisiaTurkeyTurkmenistanTuvaluUgandaUkraineUnited Arab EmiratesUnited KingdomUnited StatesUpper middle incomeUruguayUzbekistanVanuatuVenezuela, RBVietnamWorldYemen, Rep.ZambiaZimbabwe Timeline:
This timeline shows a graph from 1961 to 2015 of Heavily indebted poor countries (HIPC). No data until 1960. Number of actual observations by date: 55.
Source name:
World Development Indicators
Source organization:
World Bank staff estimates based data from International Monetary Fund's Direction of Trade database.
Categories, topics:
Private Sector, Trade
Last updated:
apr 23, 2017
Indicators value changes by year
Minimum:
1.842 bln
jan 1, 1961
Maximum:
238.768 bln
jan 1, 2015
At the date of observation
Value
Absolute change
Change from previous value
jan 1, 1961
1.842 bln
+1.842 bln
0.0%
jan 1, 1962
2.072 bln
+229.904 mln
12.48%
jan 1, 1963
2.161 bln
+88.804 mln
4.29%
jan 1, 1964
2.63 bln
+469.288 mln
21.72%
jan 1, 1965
3.387 bln
+756.998 mln
28.78%
jan 1, 1966
3.739 bln
+351.666 mln
10.38%
jan 1, 1967
3.958 bln
+218.959 mln
5.86%
jan 1, 1968
4.255 bln
+297.73 mln
7.52%
jan 1, 1969
4.593 bln
+337.922 mln
7.94%
jan 1, 1970
4.971 bln
+377.892 mln
8.23%
jan 1, 1971
5.627 bln
+655.562 mln
13.19%
jan 1, 1972
5.57 bln
-56.74 mln
-1.01%
jan 1, 1973
6.368 bln
+797.448 mln
14.32%
jan 1, 1974
7.984 bln
+1.616 bln
25.39%
jan 1, 1975
11.273 bln
+3.289 bln
41.2%
jan 1, 1976
12.833 bln
+1.56 bln
13.84%
jan 1, 1977
11.98 bln
-853.1 mln
-6.65%
jan 1, 1978
14.74 bln
+2.76 bln
23.04%
jan 1, 1979
15.733 bln
+993.642 mln
6.74%
jan 1, 1980
17.262 bln
+1.528 bln
9.71%
jan 1, 1981
21.474 bln
+4.212 bln
24.4%
jan 1, 1982
22.667 bln
+1.193 bln
5.56%
jan 1, 1983
20.209 bln
-2.457 bln
-10.84%
jan 1, 1984
18.677 bln
-1.532 bln
-7.58%
jan 1, 1985
17.843 bln
-834.312 mln
-4.47%
jan 1, 1986
18.728 bln
+885.404 mln
4.96%
jan 1, 1987
19.521 bln
+793.081 mln
4.23%
jan 1, 1988
21.67 bln
+2.149 bln
11.01%
jan 1, 1989
21.14 bln
-530.259 mln
-2.45%
jan 1, 1990
22.421 bln
+1.281 bln
6.06%
jan 1, 1991
29.105 bln
+6.684 bln
29.81%
jan 1, 1992
27.168 bln
-1.937 bln
-6.66%
jan 1, 1993
31.689 bln
+4.521 bln
16.64%
jan 1, 1994
29.523 bln
-2.165 bln
-6.83%
jan 1, 1995
30.427 bln
+903.84 mln
3.06%
jan 1, 1996
35.271 bln
+4.844 bln
15.92%
jan 1, 1997
36.299 bln
+1.028 bln
2.91%
jan 1, 1998
35.756 bln
-542.734 mln
-1.5%
jan 1, 1999
41.14 bln
+5.383 bln
15.06%
jan 1, 2000
39.823 bln
-1.317 bln
-3.2%
jan 1, 2001
39.018 bln
-805.487 mln
-2.02%
jan 1, 2002
39.914 bln
+896.63 mln
2.3%
jan 1, 2003
42.861 bln
+2.947 bln
7.38%
jan 1, 2004
50.519 bln
+7.658 bln
17.87%
jan 1, 2005
62.149 bln
+11.63 bln
23.02%
jan 1, 2006
78.449 bln
+16.3 bln
26.23%
jan 1, 2007
96.436 bln
+17.987 bln
22.93%
jan 1, 2008
117.58 bln
+21.143 bln
21.92%
jan 1, 2009
149.487 bln
+31.907 bln
27.14%
jan 1, 2010
134.537 bln
-14.949 bln
-10.0%
jan 1, 2011
158.469 bln
+23.932 bln
17.79%
jan 1, 2012
196.63 bln
+38.161 bln
24.08%
jan 1, 2013
205.814 bln
+9.184 bln
4.67%
jan 1, 2014
231.349 bln
+25.535 bln
12.41%
jan 1, 2015
238.768 bln
+7.419 bln
3.21%
Ranking of countries by current statistics by years


Comments: