29
/
en
AIzaSyAYiBZKx7MnpbEhh9jyipgxe19OcubqV5w
April 1, 2024
251025
St. Lucia
LCA
true
2
1
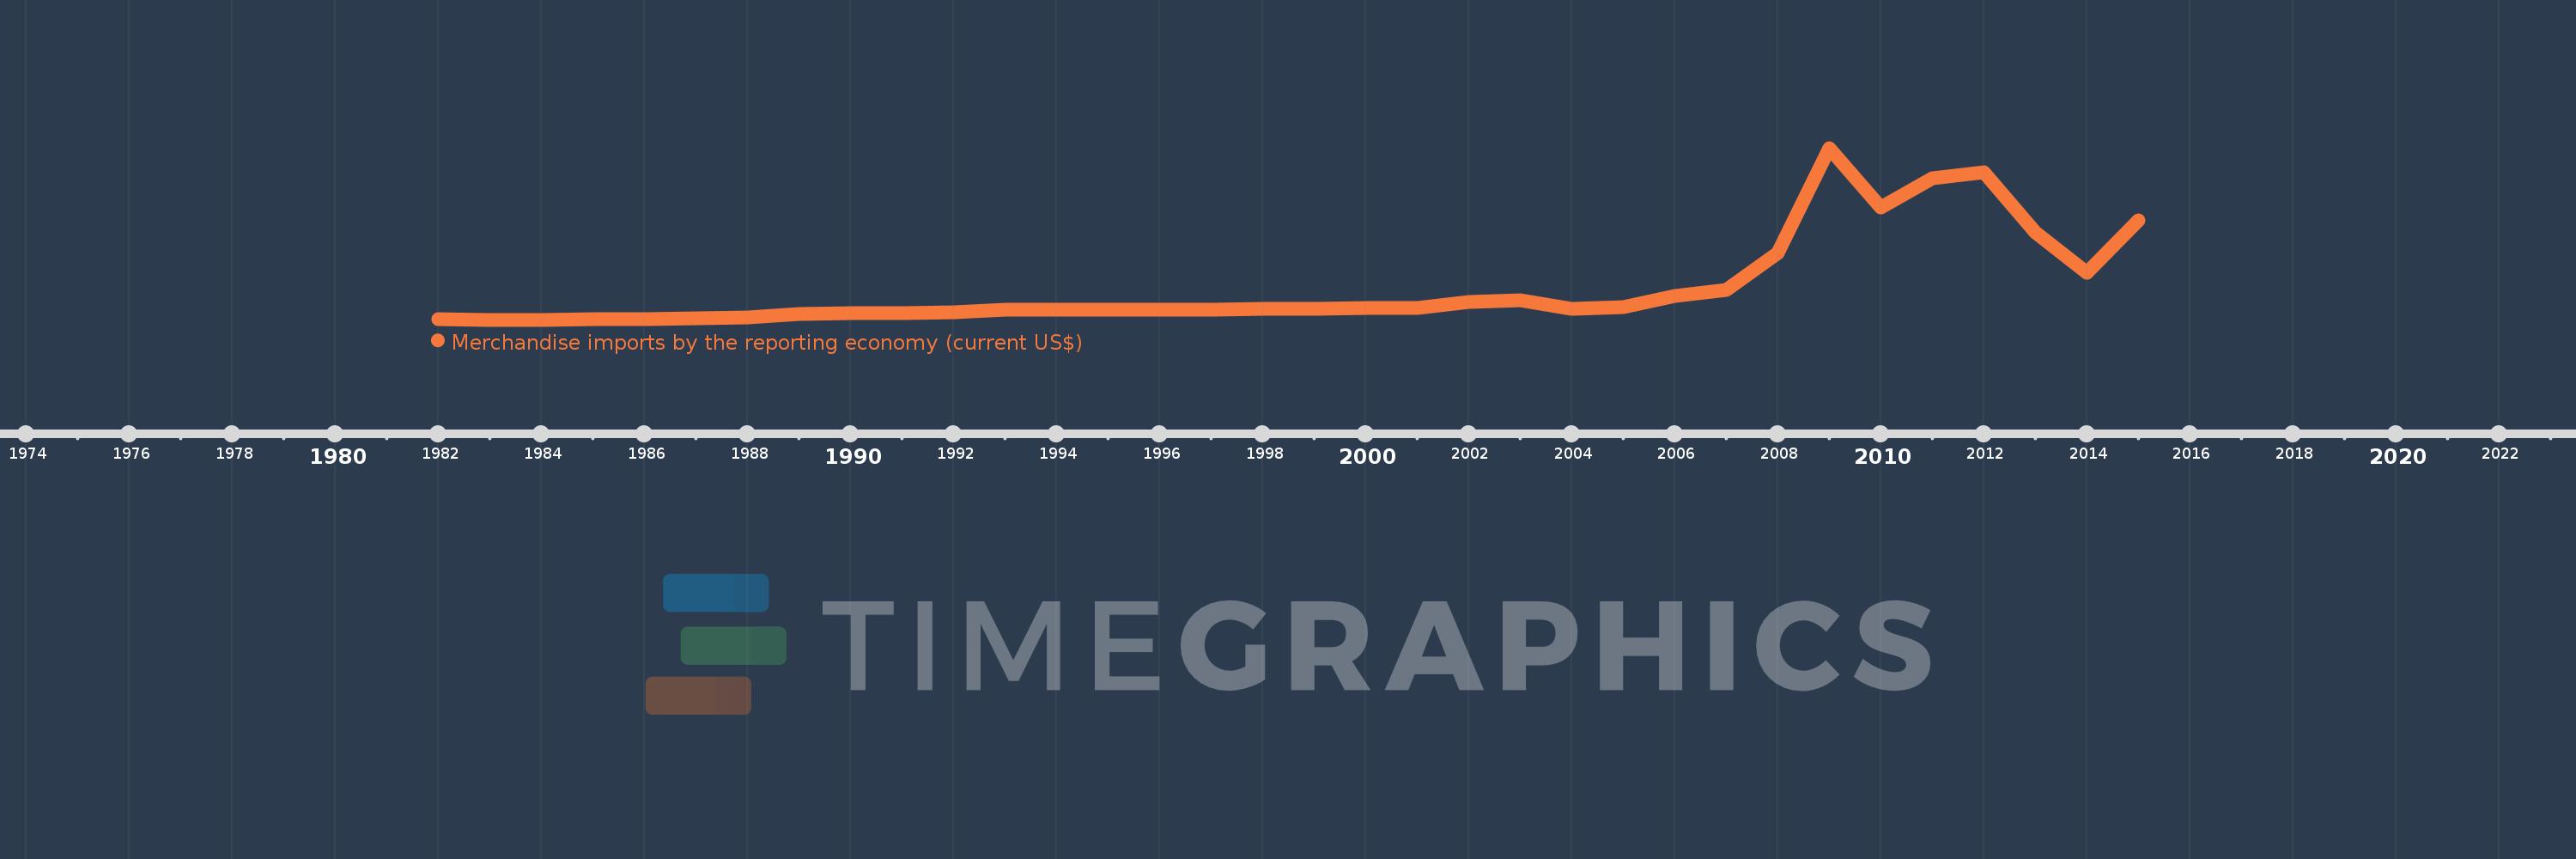
Merchandise imports by the reporting economy (current US$)
2015,2014,2013,2012,2011,2010,2009,2008,2007,2006,2005,2004,2003,2002,2001,2000,1999,1998,1997,1996,1995,1994,1993,1992,1991,1990,1989,1988,1987,1986,1985,1984,1983,1982
This statistics in other country:
AfghanistanAlbaniaAlgeriaAmerican SamoaAngolaAntigua and BarbudaArab WorldArgentinaArmeniaArubaAustraliaAustriaAzerbaijanBahamas, TheBahrainBangladeshBarbadosBelarusBelgiumBelizeBeninBermudaBoliviaBosnia and HerzegovinaBrazilBrunei DarussalamBulgariaBurkina FasoBurundiCabo VerdeCambodiaCameroonCanadaCaribbean small statesCentral African RepublicCentral Europe and the BalticsChadChileChinaColombiaComorosCongo, Dem. Rep.Congo, Rep.Costa RicaCote d'IvoireCroatiaCubaCyprusCzech RepublicDenmarkDjiboutiDominicaDominican RepublicEarly-demographic dividendEast Asia & PacificEast Asia & Pacific (excluding high income)East Asia & Pacific (IDA & IBRD countries)EcuadorEgypt, Arab Rep.El SalvadorEquatorial GuineaEstoniaEthiopiaEuro areaEurope & Central AsiaEurope & Central Asia (excluding high income)Europe & Central Asia (IDA & IBRD countries)European UnionFaroe IslandsFijiFinlandFragile and conflict affected situationsFranceFrench PolynesiaGabonGambia, TheGeorgiaGermanyGhanaGibraltarGreeceGreenlandGrenadaGuamGuatemalaGuineaGuinea-BissauGuyanaHaitiHeavily indebted poor countries (HIPC)High incomeHondurasHong Kong SAR, ChinaHungaryIBRD onlyIcelandIDA & IBRD totalIDA blendIDA onlyIDA totalIndiaIndonesiaIran, Islamic Rep.IraqIrelandIsraelItalyJamaicaJapanJordanKazakhstanKenyaKiribatiKorea, Dem. People’s Rep.Korea, Rep.KosovoKuwaitKyrgyz RepublicLao PDRLate-demographic dividendLatin America & Caribbean Latin America & Caribbean (excluding high income)Latin America & the Caribbean (IDA & IBRD countries)LatviaLeast developed countries: UN classificationLebanonLiberiaLibyaLithuaniaLow & middle incomeLow incomeLower middle incomeLuxembourgMacao SAR, ChinaMacedonia, FYRMadagascarMalawiMalaysiaMaldivesMaliMaltaMauritaniaMauritiusMexicoMiddle East & North AfricaMiddle East & North Africa (excluding high income)Middle East & North Africa (IDA & IBRD countries)Middle incomeMoldovaMongoliaMontenegroMoroccoMozambiqueMyanmarNauruNepalNetherlandsNew CaledoniaNew ZealandNicaraguaNigerNigeriaNorth AmericaNorwayOECD membersOmanOther small statesPacific island small statesPakistanPanamaPapua New GuineaParaguayPeruPhilippinesPolandPortugalPost-demographic dividendPre-demographic dividendQatarRomaniaRussian FederationRwandaSamoaSao Tome and PrincipeSaudi ArabiaSenegalSerbiaSeychellesSierra LeoneSingaporeSlovak RepublicSloveniaSmall statesSolomon IslandsSomaliaSouth AfricaSouth AsiaSouth Asia (IDA & IBRD)SpainSri LankaSt. Kitts and NevisSt. LuciaSt. Vincent and the GrenadinesSub-Saharan Africa Sub-Saharan Africa (excluding high income)Sub-Saharan Africa (IDA & IBRD countries)SudanSurinameSwedenSwitzerlandSyrian Arab RepublicTajikistanTanzaniaThailandTogoTongaTrinidad and TobagoTunisiaTurkeyTurkmenistanTuvaluUgandaUkraineUnited Arab EmiratesUnited KingdomUnited StatesUpper middle incomeUruguayUzbekistanVanuatuVenezuela, RBVietnamWorldYemen, Rep.ZambiaZimbabwe Timeline:
This timeline shows a graph from 1982 to 2015 of St. Lucia. No data until 1981. Number of actual observations by date: 34.
Source name:
World Development Indicators
Source organization:
World Bank staff estimates based data from International Monetary Fund's Direction of Trade database.
Categories, topics:
Private Sector, Trade
Last updated:
apr 23, 2017
Indicators value changes by year
Minimum:
23.181 mln
jan 1, 1984
Maximum:
4.864 bln
jan 1, 2009
At the date of observation
Value
Absolute change
Change from previous value
jan 1, 1982
33.11 mln
+33.11 mln
0.0%
jan 1, 1983
27.783 mln
-5.327 mln
-16.09%
jan 1, 1984
23.181 mln
-4.601 mln
-16.56%
jan 1, 1985
29.664 mln
+6.483 mln
27.96%
jan 1, 1986
42.696 mln
+13.032 mln
43.93%
jan 1, 1987
66.805 mln
+24.108 mln
56.47%
jan 1, 1988
79.918 mln
+13.113 mln
19.63%
jan 1, 1989
185.6 mln
+105.682 mln
132.24%
jan 1, 1990
199.725 mln
+14.124 mln
7.61%
jan 1, 1991
199.773 mln
+48.101K
0.02%
jan 1, 1992
222.363 mln
+22.59 mln
11.31%
jan 1, 1993
306.339 mln
+83.976 mln
37.77%
jan 1, 1994
300.186 mln
-6.153 mln
-2.01%
jan 1, 1995
302.635 mln
+2.45 mln
0.82%
jan 1, 1996
306.567 mln
+3.931 mln
1.3%
jan 1, 1997
312.602 mln
+6.035 mln
1.97%
jan 1, 1998
332.217 mln
+19.615 mln
6.27%
jan 1, 1999
335.203 mln
+2.986 mln
0.9%
jan 1, 2000
354.549 mln
+19.346 mln
5.77%
jan 1, 2001
349.985 mln
-4.564 mln
-1.29%
jan 1, 2002
526.482 mln
+176.497 mln
50.43%
jan 1, 2003
566.773 mln
+40.291 mln
7.65%
jan 1, 2004
342.338 mln
-224.435 mln
-39.6%
jan 1, 2005
376.123 mln
+33.785 mln
9.87%
jan 1, 2006
684.999 mln
+308.876 mln
82.12%
jan 1, 2007
855.567 mln
+170.568 mln
24.9%
jan 1, 2008
1.901 bln
+1.046 bln
122.24%
jan 1, 2009
4.864 bln
+2.962 bln
155.78%
jan 1, 2010
3.192 bln
-1.672 bln
-34.37%
jan 1, 2011
4.016 bln
+824.401 mln
25.83%
jan 1, 2012
4.178 bln
+161.261 mln
4.02%
jan 1, 2013
2.488 bln
-1.69 bln
-40.45%
jan 1, 2014
1.357 bln
-1.13 bln
-45.44%
jan 1, 2015
2.834 bln
+1.476 bln
108.77%
Ranking of countries by current statistics by years


Comments: