29
/
en
AIzaSyAYiBZKx7MnpbEhh9jyipgxe19OcubqV5w
April 1, 2024
210659
Nicaragua
NIC
true
2
1
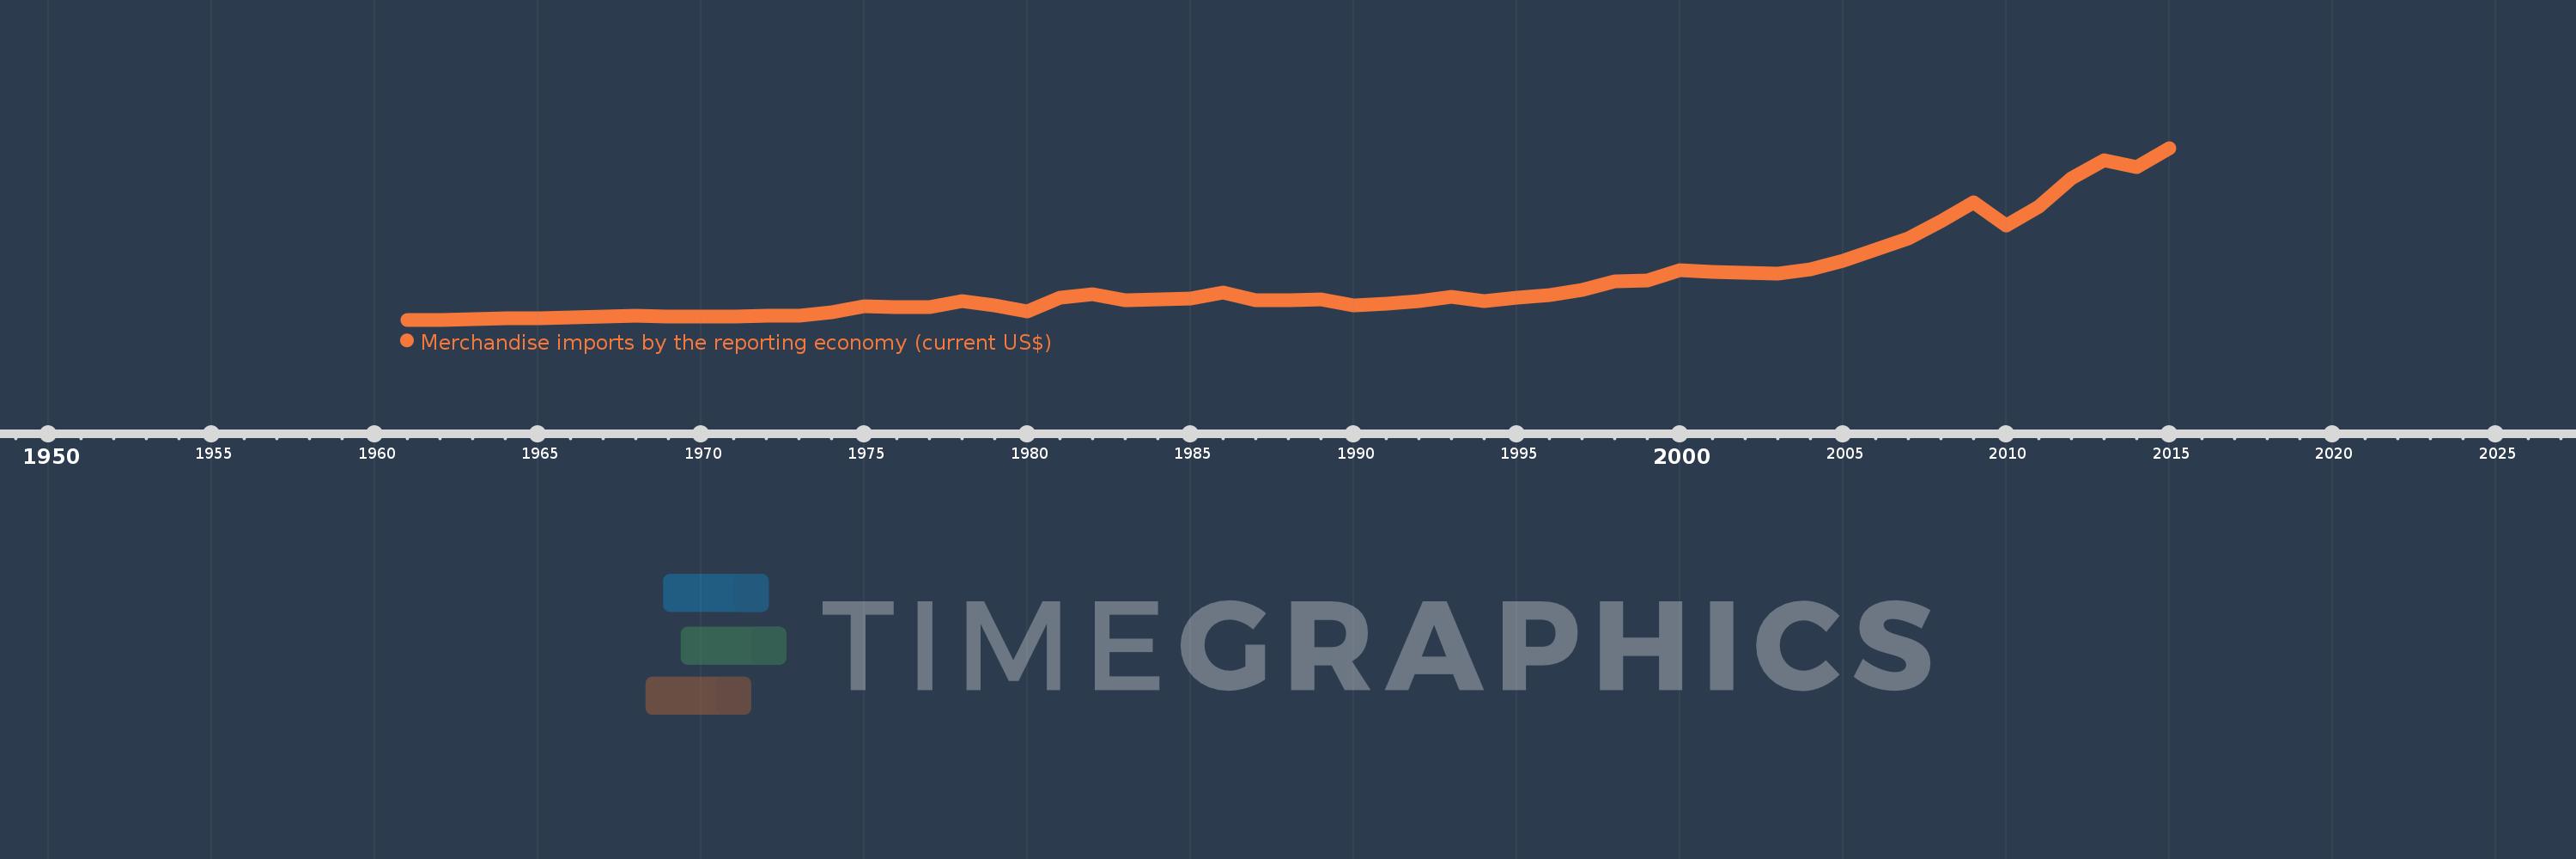
Merchandise imports by the reporting economy (current US$)
2015,2014,2013,2012,2011,2010,2009,2008,2007,2006,2005,2004,2003,2002,2001,2000,1999,1998,1997,1996,1995,1994,1993,1992,1991,1990,1989,1988,1987,1986,1985,1984,1983,1982,1981,1980,1979,1978,1977,1976,1975,1974,1973,1972,1971,1970,1969,1968,1967,1966,1965,1964,1963,1962,1961
This statistics in other country:
AfghanistanAlbaniaAlgeriaAmerican SamoaAngolaAntigua and BarbudaArab WorldArgentinaArmeniaArubaAustraliaAustriaAzerbaijanBahamas, TheBahrainBangladeshBarbadosBelarusBelgiumBelizeBeninBermudaBoliviaBosnia and HerzegovinaBrazilBrunei DarussalamBulgariaBurkina FasoBurundiCabo VerdeCambodiaCameroonCanadaCaribbean small statesCentral African RepublicCentral Europe and the BalticsChadChileChinaColombiaComorosCongo, Dem. Rep.Congo, Rep.Costa RicaCote d'IvoireCroatiaCubaCyprusCzech RepublicDenmarkDjiboutiDominicaDominican RepublicEarly-demographic dividendEast Asia & PacificEast Asia & Pacific (excluding high income)East Asia & Pacific (IDA & IBRD countries)EcuadorEgypt, Arab Rep.El SalvadorEquatorial GuineaEstoniaEthiopiaEuro areaEurope & Central AsiaEurope & Central Asia (excluding high income)Europe & Central Asia (IDA & IBRD countries)European UnionFaroe IslandsFijiFinlandFragile and conflict affected situationsFranceFrench PolynesiaGabonGambia, TheGeorgiaGermanyGhanaGibraltarGreeceGreenlandGrenadaGuamGuatemalaGuineaGuinea-BissauGuyanaHaitiHeavily indebted poor countries (HIPC)High incomeHondurasHong Kong SAR, ChinaHungaryIBRD onlyIcelandIDA & IBRD totalIDA blendIDA onlyIDA totalIndiaIndonesiaIran, Islamic Rep.IraqIrelandIsraelItalyJamaicaJapanJordanKazakhstanKenyaKiribatiKorea, Dem. People’s Rep.Korea, Rep.KosovoKuwaitKyrgyz RepublicLao PDRLate-demographic dividendLatin America & Caribbean Latin America & Caribbean (excluding high income)Latin America & the Caribbean (IDA & IBRD countries)LatviaLeast developed countries: UN classificationLebanonLiberiaLibyaLithuaniaLow & middle incomeLow incomeLower middle incomeLuxembourgMacao SAR, ChinaMacedonia, FYRMadagascarMalawiMalaysiaMaldivesMaliMaltaMauritaniaMauritiusMexicoMiddle East & North AfricaMiddle East & North Africa (excluding high income)Middle East & North Africa (IDA & IBRD countries)Middle incomeMoldovaMongoliaMontenegroMoroccoMozambiqueMyanmarNauruNepalNetherlandsNew CaledoniaNew ZealandNicaraguaNigerNigeriaNorth AmericaNorwayOECD membersOmanOther small statesPacific island small statesPakistanPanamaPapua New GuineaParaguayPeruPhilippinesPolandPortugalPost-demographic dividendPre-demographic dividendQatarRomaniaRussian FederationRwandaSamoaSao Tome and PrincipeSaudi ArabiaSenegalSerbiaSeychellesSierra LeoneSingaporeSlovak RepublicSloveniaSmall statesSolomon IslandsSomaliaSouth AfricaSouth AsiaSouth Asia (IDA & IBRD)SpainSri LankaSt. Kitts and NevisSt. LuciaSt. Vincent and the GrenadinesSub-Saharan Africa Sub-Saharan Africa (excluding high income)Sub-Saharan Africa (IDA & IBRD countries)SudanSurinameSwedenSwitzerlandSyrian Arab RepublicTajikistanTanzaniaThailandTogoTongaTrinidad and TobagoTunisiaTurkeyTurkmenistanTuvaluUgandaUkraineUnited Arab EmiratesUnited KingdomUnited StatesUpper middle incomeUruguayUzbekistanVanuatuVenezuela, RBVietnamWorldYemen, Rep.ZambiaZimbabwe Timeline:
This timeline shows a graph from 1961 to 2015 of Nicaragua. No data until 1960. Number of actual observations by date: 55.
Source name:
World Development Indicators
Source organization:
World Bank staff estimates based data from International Monetary Fund's Direction of Trade database.
Categories, topics:
Private Sector, Trade
Last updated:
apr 23, 2017
Indicators value changes by year
Minimum:
71.1 mln
jan 1, 1961
Maximum:
6.305 bln
jan 1, 2015
At the date of observation
Value
Absolute change
Change from previous value
jan 1, 1961
71.1 mln
+71.1 mln
0.0%
jan 1, 1962
74.4 mln
+3.3 mln
4.64%
jan 1, 1963
98.0 mln
+23.6 mln
31.72%
jan 1, 1964
110.7 mln
+12.7 mln
12.96%
jan 1, 1965
137.1 mln
+26.4 mln
23.85%
jan 1, 1966
160.2 mln
+23.1 mln
16.85%
jan 1, 1967
181.8 mln
+21.6 mln
13.48%
jan 1, 1968
203.6 mln
+21.8 mln
11.99%
jan 1, 1969
183.3 mln
-20.3 mln
-9.97%
jan 1, 1970
176.888 mln
-6.412 mln
-3.5%
jan 1, 1971
198.885 mln
+21.997 mln
12.44%
jan 1, 1972
210.801 mln
+11.916 mln
5.99%
jan 1, 1973
218.45 mln
+7.649 mln
3.63%
jan 1, 1974
326.863 mln
+108.413 mln
49.63%
jan 1, 1975
560.417 mln
+233.554 mln
71.45%
jan 1, 1976
516.776 mln
-43.641 mln
-7.79%
jan 1, 1977
532.129 mln
+15.353 mln
2.97%
jan 1, 1978
762.013 mln
+229.884 mln
43.2%
jan 1, 1979
593.239 mln
-168.774 mln
-22.15%
jan 1, 1980
360.0 mln
-233.239 mln
-39.32%
jan 1, 1981
881.882 mln
+521.882 mln
144.97%
jan 1, 1982
994.222 mln
+112.34 mln
12.74%
jan 1, 1983
774.881 mln
-219.341 mln
-22.06%
jan 1, 1984
806.252 mln
+31.371 mln
4.05%
jan 1, 1985
825.883 mln
+19.631 mln
2.43%
jan 1, 1986
1.067 bln
+240.626 mln
29.14%
jan 1, 1987
774.499 mln
-292.01 mln
-27.38%
jan 1, 1988
781.601 mln
+7.102 mln
0.92%
jan 1, 1989
805.354 mln
+23.753 mln
3.04%
jan 1, 1990
605.789 mln
-199.565 mln
-24.78%
jan 1, 1991
666.727 mln
+60.938 mln
10.06%
jan 1, 1992
751.32 mln
+84.593 mln
12.69%
jan 1, 1993
893.289 mln
+141.969 mln
18.9%
jan 1, 1994
753.4 mln
-139.889 mln
-15.66%
jan 1, 1995
866.5 mln
+113.1 mln
15.01%
jan 1, 1996
975.2 mln
+108.7 mln
12.54%
jan 1, 1997
1.154 bln
+178.5 mln
18.3%
jan 1, 1998
1.45 bln
+296.1 mln
25.67%
jan 1, 1999
1.492 bln
+41.9 mln
2.89%
jan 1, 2000
1.862 bln
+370.0 mln
24.8%
jan 1, 2001
1.805 bln
-56.226 mln
-3.02%
jan 1, 2002
1.775 bln
-30.156 mln
-1.67%
jan 1, 2003
1.754 bln
-21.584 mln
-1.22%
jan 1, 2004
1.887 bln
+132.871 mln
7.58%
jan 1, 2005
2.21 bln
+323.03 mln
17.12%
jan 1, 2006
2.623 bln
+413.557 mln
18.72%
jan 1, 2007
3.026 bln
+403.195 mln
15.37%
jan 1, 2008
3.661 bln
+634.75 mln
20.97%
jan 1, 2009
4.338 bln
+676.619 mln
18.48%
jan 1, 2010
3.477 bln
-860.364 mln
-19.83%
jan 1, 2011
4.185 bln
+707.764 mln
20.35%
jan 1, 2012
5.197 bln
+1.012 bln
24.18%
jan 1, 2013
5.854 bln
+656.878 mln
12.64%
jan 1, 2014
5.624 bln
-229.875 mln
-3.93%
jan 1, 2015
6.305 bln
+681.399 mln
12.12%
Ranking of countries by current statistics by years


Comments: