29
/
en
AIzaSyAYiBZKx7MnpbEhh9jyipgxe19OcubqV5w
April 1, 2024
253291
Sudan
SDN
true
2
1
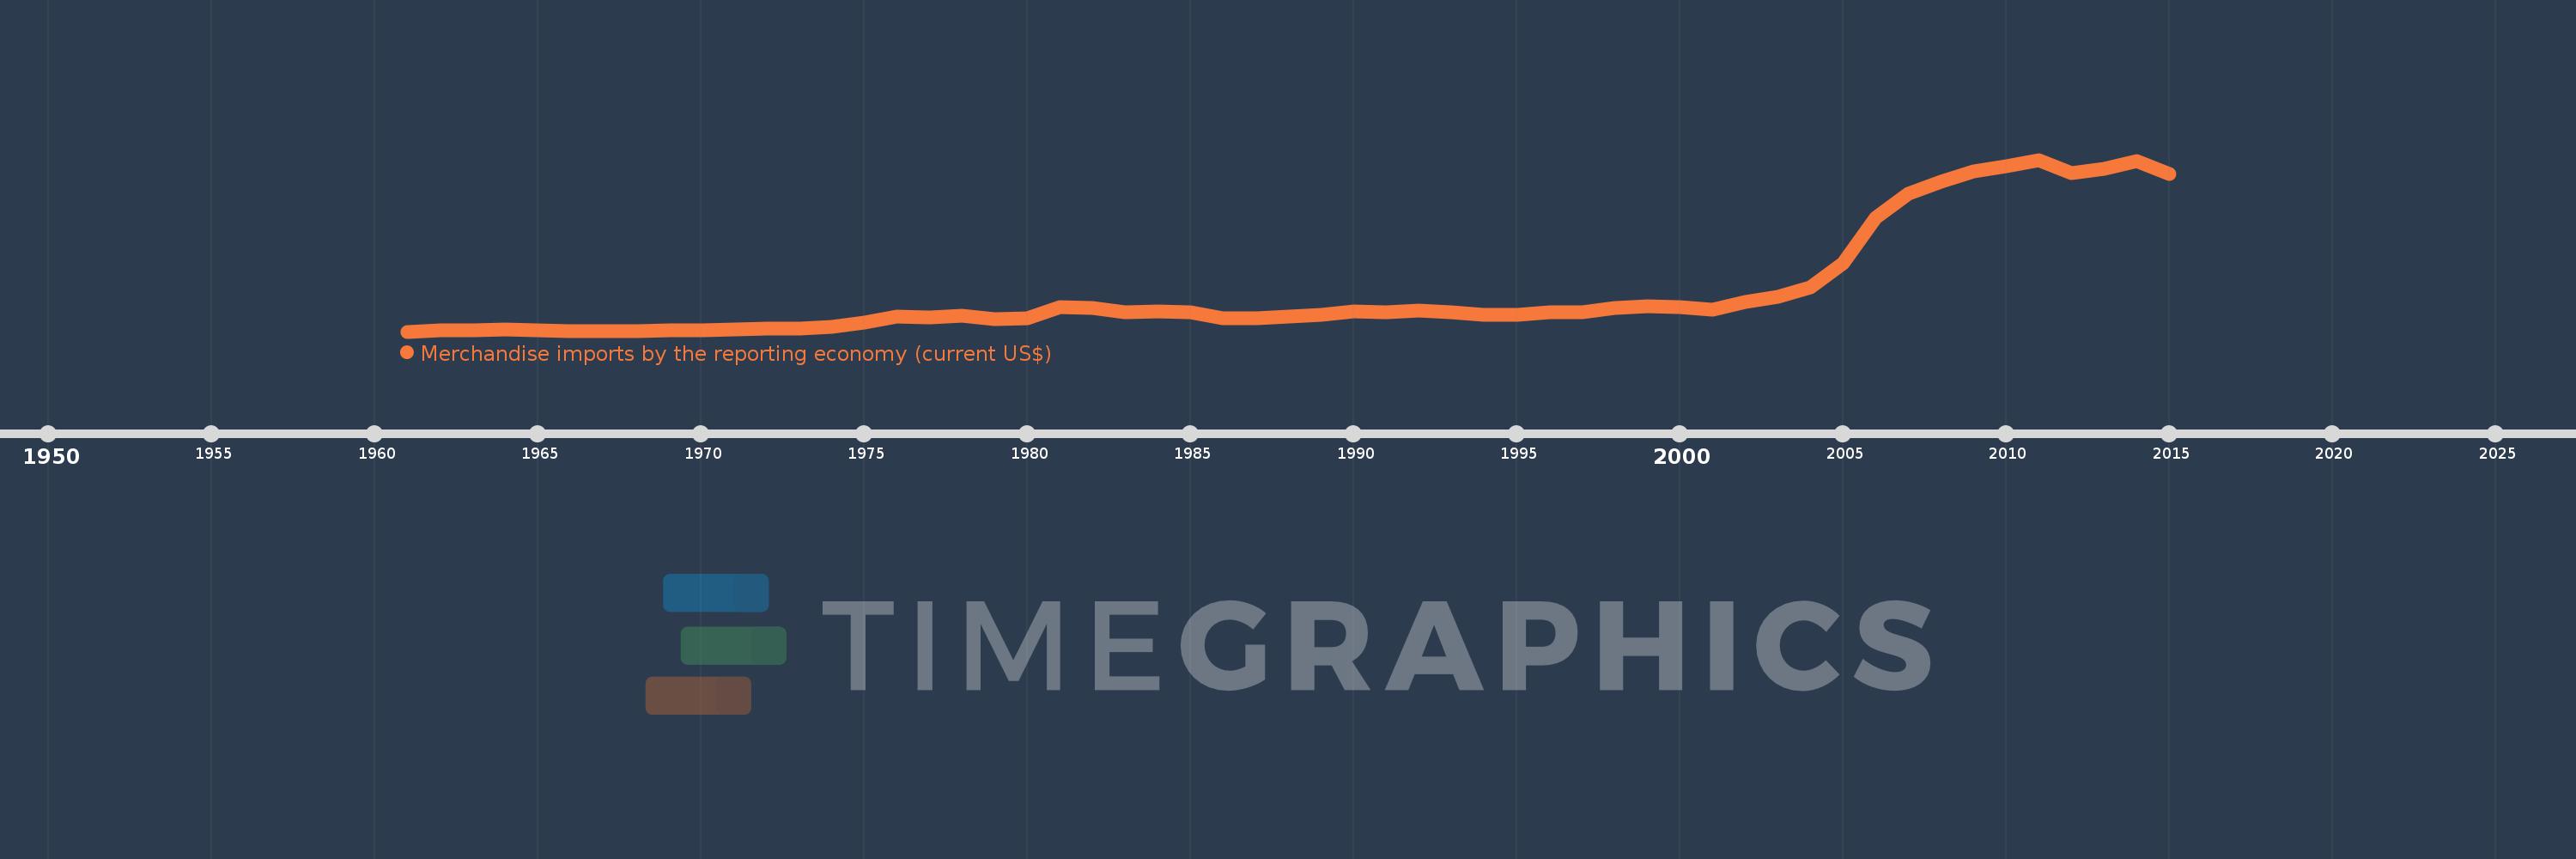
Merchandise imports by the reporting economy (current US$)
2015,2014,2013,2012,2011,2010,2009,2008,2007,2006,2005,2004,2003,2002,2001,2000,1999,1998,1997,1996,1995,1994,1993,1992,1991,1990,1989,1988,1987,1986,1985,1984,1983,1982,1981,1980,1979,1978,1977,1976,1975,1974,1973,1972,1971,1970,1969,1968,1967,1966,1965,1964,1963,1962,1961
This statistics in other country:
AfghanistanAlbaniaAlgeriaAmerican SamoaAngolaAntigua and BarbudaArab WorldArgentinaArmeniaArubaAustraliaAustriaAzerbaijanBahamas, TheBahrainBangladeshBarbadosBelarusBelgiumBelizeBeninBermudaBoliviaBosnia and HerzegovinaBrazilBrunei DarussalamBulgariaBurkina FasoBurundiCabo VerdeCambodiaCameroonCanadaCaribbean small statesCentral African RepublicCentral Europe and the BalticsChadChileChinaColombiaComorosCongo, Dem. Rep.Congo, Rep.Costa RicaCote d'IvoireCroatiaCubaCyprusCzech RepublicDenmarkDjiboutiDominicaDominican RepublicEarly-demographic dividendEast Asia & PacificEast Asia & Pacific (excluding high income)East Asia & Pacific (IDA & IBRD countries)EcuadorEgypt, Arab Rep.El SalvadorEquatorial GuineaEstoniaEthiopiaEuro areaEurope & Central AsiaEurope & Central Asia (excluding high income)Europe & Central Asia (IDA & IBRD countries)European UnionFaroe IslandsFijiFinlandFragile and conflict affected situationsFranceFrench PolynesiaGabonGambia, TheGeorgiaGermanyGhanaGibraltarGreeceGreenlandGrenadaGuamGuatemalaGuineaGuinea-BissauGuyanaHaitiHeavily indebted poor countries (HIPC)High incomeHondurasHong Kong SAR, ChinaHungaryIBRD onlyIcelandIDA & IBRD totalIDA blendIDA onlyIDA totalIndiaIndonesiaIran, Islamic Rep.IraqIrelandIsraelItalyJamaicaJapanJordanKazakhstanKenyaKiribatiKorea, Dem. People’s Rep.Korea, Rep.KosovoKuwaitKyrgyz RepublicLao PDRLate-demographic dividendLatin America & Caribbean Latin America & Caribbean (excluding high income)Latin America & the Caribbean (IDA & IBRD countries)LatviaLeast developed countries: UN classificationLebanonLiberiaLibyaLithuaniaLow & middle incomeLow incomeLower middle incomeLuxembourgMacao SAR, ChinaMacedonia, FYRMadagascarMalawiMalaysiaMaldivesMaliMaltaMauritaniaMauritiusMexicoMiddle East & North AfricaMiddle East & North Africa (excluding high income)Middle East & North Africa (IDA & IBRD countries)Middle incomeMoldovaMongoliaMontenegroMoroccoMozambiqueMyanmarNauruNepalNetherlandsNew CaledoniaNew ZealandNicaraguaNigerNigeriaNorth AmericaNorwayOECD membersOmanOther small statesPacific island small statesPakistanPanamaPapua New GuineaParaguayPeruPhilippinesPolandPortugalPost-demographic dividendPre-demographic dividendQatarRomaniaRussian FederationRwandaSamoaSao Tome and PrincipeSaudi ArabiaSenegalSerbiaSeychellesSierra LeoneSingaporeSlovak RepublicSloveniaSmall statesSolomon IslandsSomaliaSouth AfricaSouth AsiaSouth Asia (IDA & IBRD)SpainSri LankaSt. Kitts and NevisSt. LuciaSt. Vincent and the GrenadinesSub-Saharan Africa Sub-Saharan Africa (excluding high income)Sub-Saharan Africa (IDA & IBRD countries)SudanSurinameSwedenSwitzerlandSyrian Arab RepublicTajikistanTanzaniaThailandTogoTongaTrinidad and TobagoTunisiaTurkeyTurkmenistanTuvaluUgandaUkraineUnited Arab EmiratesUnited KingdomUnited StatesUpper middle incomeUruguayUzbekistanVanuatuVenezuela, RBVietnamWorldYemen, Rep.ZambiaZimbabwe Timeline:
This timeline shows a graph from 1961 to 2015 of Sudan. No data until 1960. Number of actual observations by date: 55.
Source name:
World Development Indicators
Source organization:
World Bank staff estimates based data from International Monetary Fund's Direction of Trade database.
Categories, topics:
Private Sector, Trade
Last updated:
apr 23, 2017
Indicators value changes by year
Minimum:
180.5 mln
jan 1, 1961
Maximum:
10.002 bln
jan 1, 2011
At the date of observation
Value
Absolute change
Change from previous value
jan 1, 1961
180.5 mln
+180.5 mln
0.0%
jan 1, 1962
238.5 mln
+58.0 mln
32.13%
jan 1, 1963
256.3 mln
+17.8 mln
7.46%
jan 1, 1964
284.0 mln
+27.7 mln
10.81%
jan 1, 1965
273.2 mln
-10.8 mln
-3.8%
jan 1, 1966
207.9 mln
-65.3 mln
-23.9%
jan 1, 1967
222.5 mln
+14.6 mln
7.02%
jan 1, 1968
213.2 mln
-9.3 mln
-4.18%
jan 1, 1969
257.6 mln
+44.4 mln
20.83%
jan 1, 1970
255.983 mln
-1.617 mln
-0.63%
jan 1, 1971
287.534 mln
+31.551 mln
12.33%
jan 1, 1972
331.492 mln
+43.958 mln
15.29%
jan 1, 1973
338.61 mln
+7.118 mln
2.15%
jan 1, 1974
436.056 mln
+97.446 mln
28.78%
jan 1, 1975
710.722 mln
+274.666 mln
62.99%
jan 1, 1976
1.033 bln
+322.689 mln
45.4%
jan 1, 1977
981.013 mln
-52.398 mln
-5.07%
jan 1, 1978
1.079 bln
+97.514 mln
9.94%
jan 1, 1979
875.472 mln
-203.055 mln
-18.83%
jan 1, 1980
918.647 mln
+43.175 mln
4.93%
jan 1, 1981
1.576 bln
+657.287 mln
71.55%
jan 1, 1982
1.551 bln
-24.958 mln
-1.58%
jan 1, 1983
1.275 bln
-276.437 mln
-17.82%
jan 1, 1984
1.355 bln
+79.989 mln
6.28%
jan 1, 1985
1.278 bln
-76.621 mln
-5.66%
jan 1, 1986
920.436 mln
-357.471 mln
-27.97%
jan 1, 1987
963.562 mln
+43.126 mln
4.69%
jan 1, 1988
1.055 bln
+91.776 mln
9.52%
jan 1, 1989
1.128 bln
+72.622 mln
6.88%
jan 1, 1990
1.34 bln
+212.296 mln
18.82%
jan 1, 1991
1.305 bln
-35.398 mln
-2.64%
jan 1, 1992
1.401 bln
+95.986 mln
7.36%
jan 1, 1993
1.261 bln
-139.358 mln
-9.95%
jan 1, 1994
1.153 bln
-108.285 mln
-8.58%
jan 1, 1995
1.152 bln
-1.557 mln
-0.13%
jan 1, 1996
1.263 bln
+110.944 mln
9.63%
jan 1, 1997
1.298 bln
+35.864 mln
2.84%
jan 1, 1998
1.511 bln
+212.204 mln
16.34%
jan 1, 1999
1.605 bln
+94.172 mln
6.23%
jan 1, 2000
1.577 bln
-27.833 mln
-1.73%
jan 1, 2001
1.453 bln
-124.234 mln
-7.88%
jan 1, 2002
1.889 bln
+436.389 mln
30.04%
jan 1, 2003
2.165 bln
+276.103 mln
14.62%
jan 1, 2004
2.731 bln
+565.994 mln
26.14%
jan 1, 2005
4.086 bln
+1.355 bln
49.6%
jan 1, 2006
6.69 bln
+2.604 bln
63.73%
jan 1, 2007
8.074 bln
+1.384 bln
20.68%
jan 1, 2008
8.742 bln
+667.809 mln
8.27%
jan 1, 2009
9.332 bln
+590.952 mln
6.76%
jan 1, 2010
9.656 bln
+323.569 mln
3.47%
jan 1, 2011
10.002 bln
+345.672 mln
3.58%
jan 1, 2012
9.227 bln
-774.531 mln
-7.74%
jan 1, 2013
9.475 bln
+247.84 mln
2.69%
jan 1, 2014
9.918 bln
+443.05 mln
4.68%
jan 1, 2015
9.211 bln
-706.768 mln
-7.13%
Ranking of countries by current statistics by years


Comments: