29
/
en
AIzaSyAYiBZKx7MnpbEhh9jyipgxe19OcubqV5w
April 1, 2024
35944
High income
HIC
false
2
1
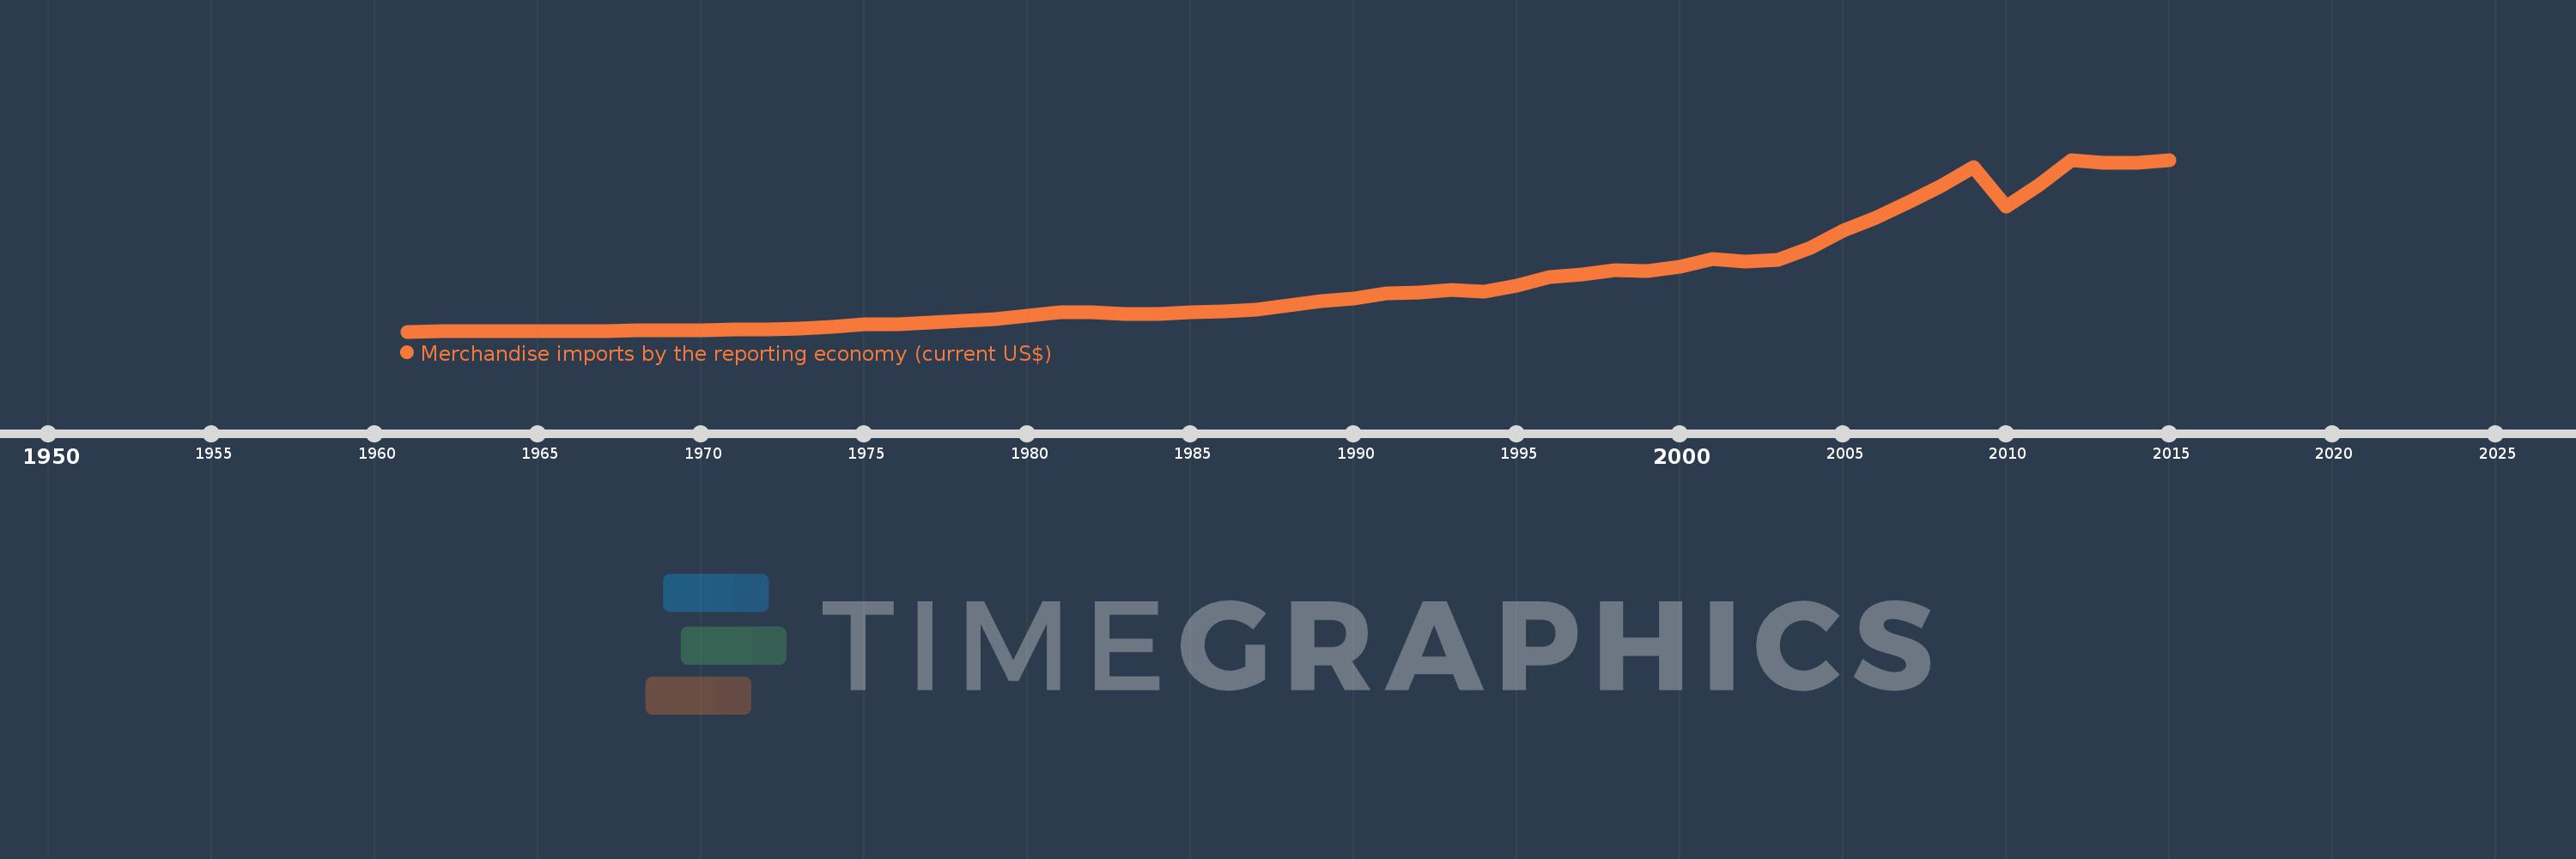
Merchandise imports by the reporting economy (current US$)
2015,2014,2013,2012,2011,2010,2009,2008,2007,2006,2005,2004,2003,2002,2001,2000,1999,1998,1997,1996,1995,1994,1993,1992,1991,1990,1989,1988,1987,1986,1985,1984,1983,1982,1981,1980,1979,1978,1977,1976,1975,1974,1973,1972,1971,1970,1969,1968,1967,1966,1965,1964,1963,1962,1961
This statistics in other country:
AfghanistanAlbaniaAlgeriaAmerican SamoaAngolaAntigua and BarbudaArab WorldArgentinaArmeniaArubaAustraliaAustriaAzerbaijanBahamas, TheBahrainBangladeshBarbadosBelarusBelgiumBelizeBeninBermudaBoliviaBosnia and HerzegovinaBrazilBrunei DarussalamBulgariaBurkina FasoBurundiCabo VerdeCambodiaCameroonCanadaCaribbean small statesCentral African RepublicCentral Europe and the BalticsChadChileChinaColombiaComorosCongo, Dem. Rep.Congo, Rep.Costa RicaCote d'IvoireCroatiaCubaCyprusCzech RepublicDenmarkDjiboutiDominicaDominican RepublicEarly-demographic dividendEast Asia & PacificEast Asia & Pacific (excluding high income)East Asia & Pacific (IDA & IBRD countries)EcuadorEgypt, Arab Rep.El SalvadorEquatorial GuineaEstoniaEthiopiaEuro areaEurope & Central AsiaEurope & Central Asia (excluding high income)Europe & Central Asia (IDA & IBRD countries)European UnionFaroe IslandsFijiFinlandFragile and conflict affected situationsFranceFrench PolynesiaGabonGambia, TheGeorgiaGermanyGhanaGibraltarGreeceGreenlandGrenadaGuamGuatemalaGuineaGuinea-BissauGuyanaHaitiHeavily indebted poor countries (HIPC)High incomeHondurasHong Kong SAR, ChinaHungaryIBRD onlyIcelandIDA & IBRD totalIDA blendIDA onlyIDA totalIndiaIndonesiaIran, Islamic Rep.IraqIrelandIsraelItalyJamaicaJapanJordanKazakhstanKenyaKiribatiKorea, Dem. People’s Rep.Korea, Rep.KosovoKuwaitKyrgyz RepublicLao PDRLate-demographic dividendLatin America & Caribbean Latin America & Caribbean (excluding high income)Latin America & the Caribbean (IDA & IBRD countries)LatviaLeast developed countries: UN classificationLebanonLiberiaLibyaLithuaniaLow & middle incomeLow incomeLower middle incomeLuxembourgMacao SAR, ChinaMacedonia, FYRMadagascarMalawiMalaysiaMaldivesMaliMaltaMauritaniaMauritiusMexicoMiddle East & North AfricaMiddle East & North Africa (excluding high income)Middle East & North Africa (IDA & IBRD countries)Middle incomeMoldovaMongoliaMontenegroMoroccoMozambiqueMyanmarNauruNepalNetherlandsNew CaledoniaNew ZealandNicaraguaNigerNigeriaNorth AmericaNorwayOECD membersOmanOther small statesPacific island small statesPakistanPanamaPapua New GuineaParaguayPeruPhilippinesPolandPortugalPost-demographic dividendPre-demographic dividendQatarRomaniaRussian FederationRwandaSamoaSao Tome and PrincipeSaudi ArabiaSenegalSerbiaSeychellesSierra LeoneSingaporeSlovak RepublicSloveniaSmall statesSolomon IslandsSomaliaSouth AfricaSouth AsiaSouth Asia (IDA & IBRD)SpainSri LankaSt. Kitts and NevisSt. LuciaSt. Vincent and the GrenadinesSub-Saharan Africa Sub-Saharan Africa (excluding high income)Sub-Saharan Africa (IDA & IBRD countries)SudanSurinameSwedenSwitzerlandSyrian Arab RepublicTajikistanTanzaniaThailandTogoTongaTrinidad and TobagoTunisiaTurkeyTurkmenistanTuvaluUgandaUkraineUnited Arab EmiratesUnited KingdomUnited StatesUpper middle incomeUruguayUzbekistanVanuatuVenezuela, RBVietnamWorldYemen, Rep.ZambiaZimbabwe Timeline:
This timeline shows a graph from 1961 to 2015 of High income. No data until 1960. Number of actual observations by date: 55.
Source name:
World Development Indicators
Source organization:
World Bank staff estimates based data from International Monetary Fund's Direction of Trade database.
Categories, topics:
Private Sector, Trade
Last updated:
apr 23, 2017
Indicators value changes by year
Minimum:
85.418 bln
jan 1, 1961
Maximum:
12.538 trl
jan 1, 2015
At the date of observation
Value
Absolute change
Change from previous value
jan 1, 1961
85.418 bln
+85.418 bln
0.0%
jan 1, 1962
89.598 bln
+4.18 bln
4.89%
jan 1, 1963
96.967 bln
+7.369 bln
8.22%
jan 1, 1964
106.919 bln
+9.952 bln
10.26%
jan 1, 1965
120.068 bln
+13.149 bln
12.3%
jan 1, 1966
131.593 bln
+11.525 bln
9.6%
jan 1, 1967
147.663 bln
+16.07 bln
12.21%
jan 1, 1968
155.512 bln
+7.849 bln
5.32%
jan 1, 1969
178.041 bln
+22.529 bln
14.49%
jan 1, 1970
206.163 bln
+28.122 bln
15.8%
jan 1, 1971
241.772 bln
+35.608 bln
17.27%
jan 1, 1972
270.115 bln
+28.344 bln
11.72%
jan 1, 1973
321.051 bln
+50.936 bln
18.86%
jan 1, 1974
444.653 bln
+123.601 bln
38.5%
jan 1, 1975
637.765 bln
+193.113 bln
43.43%
jan 1, 1976
644.995 bln
+7.229 bln
1.13%
jan 1, 1977
746.09 bln
+101.095 bln
15.67%
jan 1, 1978
853.798 bln
+107.708 bln
14.44%
jan 1, 1979
990.392 bln
+136.594 bln
16.0%
jan 1, 1980
1.263 trl
+272.292 bln
27.49%
jan 1, 1981
1.515 trl
+252.344 bln
19.98%
jan 1, 1982
1.473 trl
-42.295 bln
-2.79%
jan 1, 1983
1.39 trl
-82.946 bln
-5.63%
jan 1, 1984
1.372 trl
-17.55 bln
-1.26%
jan 1, 1985
1.486 trl
+113.684 bln
8.28%
jan 1, 1986
1.523 trl
+36.978 bln
2.49%
jan 1, 1987
1.689 trl
+165.98 bln
10.9%
jan 1, 1988
1.999 trl
+310.363 bln
18.38%
jan 1, 1989
2.293 trl
+293.851 bln
14.7%
jan 1, 1990
2.481 trl
+188.182 bln
8.21%
jan 1, 1991
2.831 trl
+349.574 bln
14.09%
jan 1, 1992
2.917 trl
+85.684 bln
3.03%
jan 1, 1993
3.084 trl
+166.993 bln
5.73%
jan 1, 1994
2.989 trl
-95.007 bln
-3.08%
jan 1, 1995
3.4 trl
+411.761 bln
13.78%
jan 1, 1996
4.027 trl
+626.909 bln
18.44%
jan 1, 1997
4.201 trl
+173.852 bln
4.32%
jan 1, 1998
4.51 trl
+309.406 bln
7.36%
jan 1, 1999
4.494 trl
-16.393 bln
-0.36%
jan 1, 2000
4.782 trl
+288.327 bln
6.42%
jan 1, 2001
5.352 trl
+569.356 bln
11.91%
jan 1, 2002
5.13 trl
-221.51 bln
-4.14%
jan 1, 2003
5.288 trl
+157.502 bln
3.07%
jan 1, 2004
6.142 trl
+853.831 bln
16.15%
jan 1, 2005
7.381 trl
+1.24 trl
20.19%
jan 1, 2006
8.311 trl
+929.494 bln
12.59%
jan 1, 2007
9.436 trl
+1.125 trl
13.54%
jan 1, 2008
10.665 trl
+1.229 trl
13.03%
jan 1, 2009
12.03 trl
+1.365 trl
12.8%
jan 1, 2010
9.135 trl
-2.895 trl
-24.06%
jan 1, 2011
10.693 trl
+1.558 trl
17.05%
jan 1, 2012
12.49 trl
+1.797 trl
16.81%
jan 1, 2013
12.325 trl
-165.197 bln
-1.32%
jan 1, 2014
12.34 trl
+14.672 bln
0.12%
jan 1, 2015
12.538 trl
+198.131 bln
1.61%
Ranking of countries by current statistics by years


Comments: