29
/
en
AIzaSyAYiBZKx7MnpbEhh9jyipgxe19OcubqV5w
April 1, 2024
157570
Iran, Islamic Rep.
IRN
true
2
1
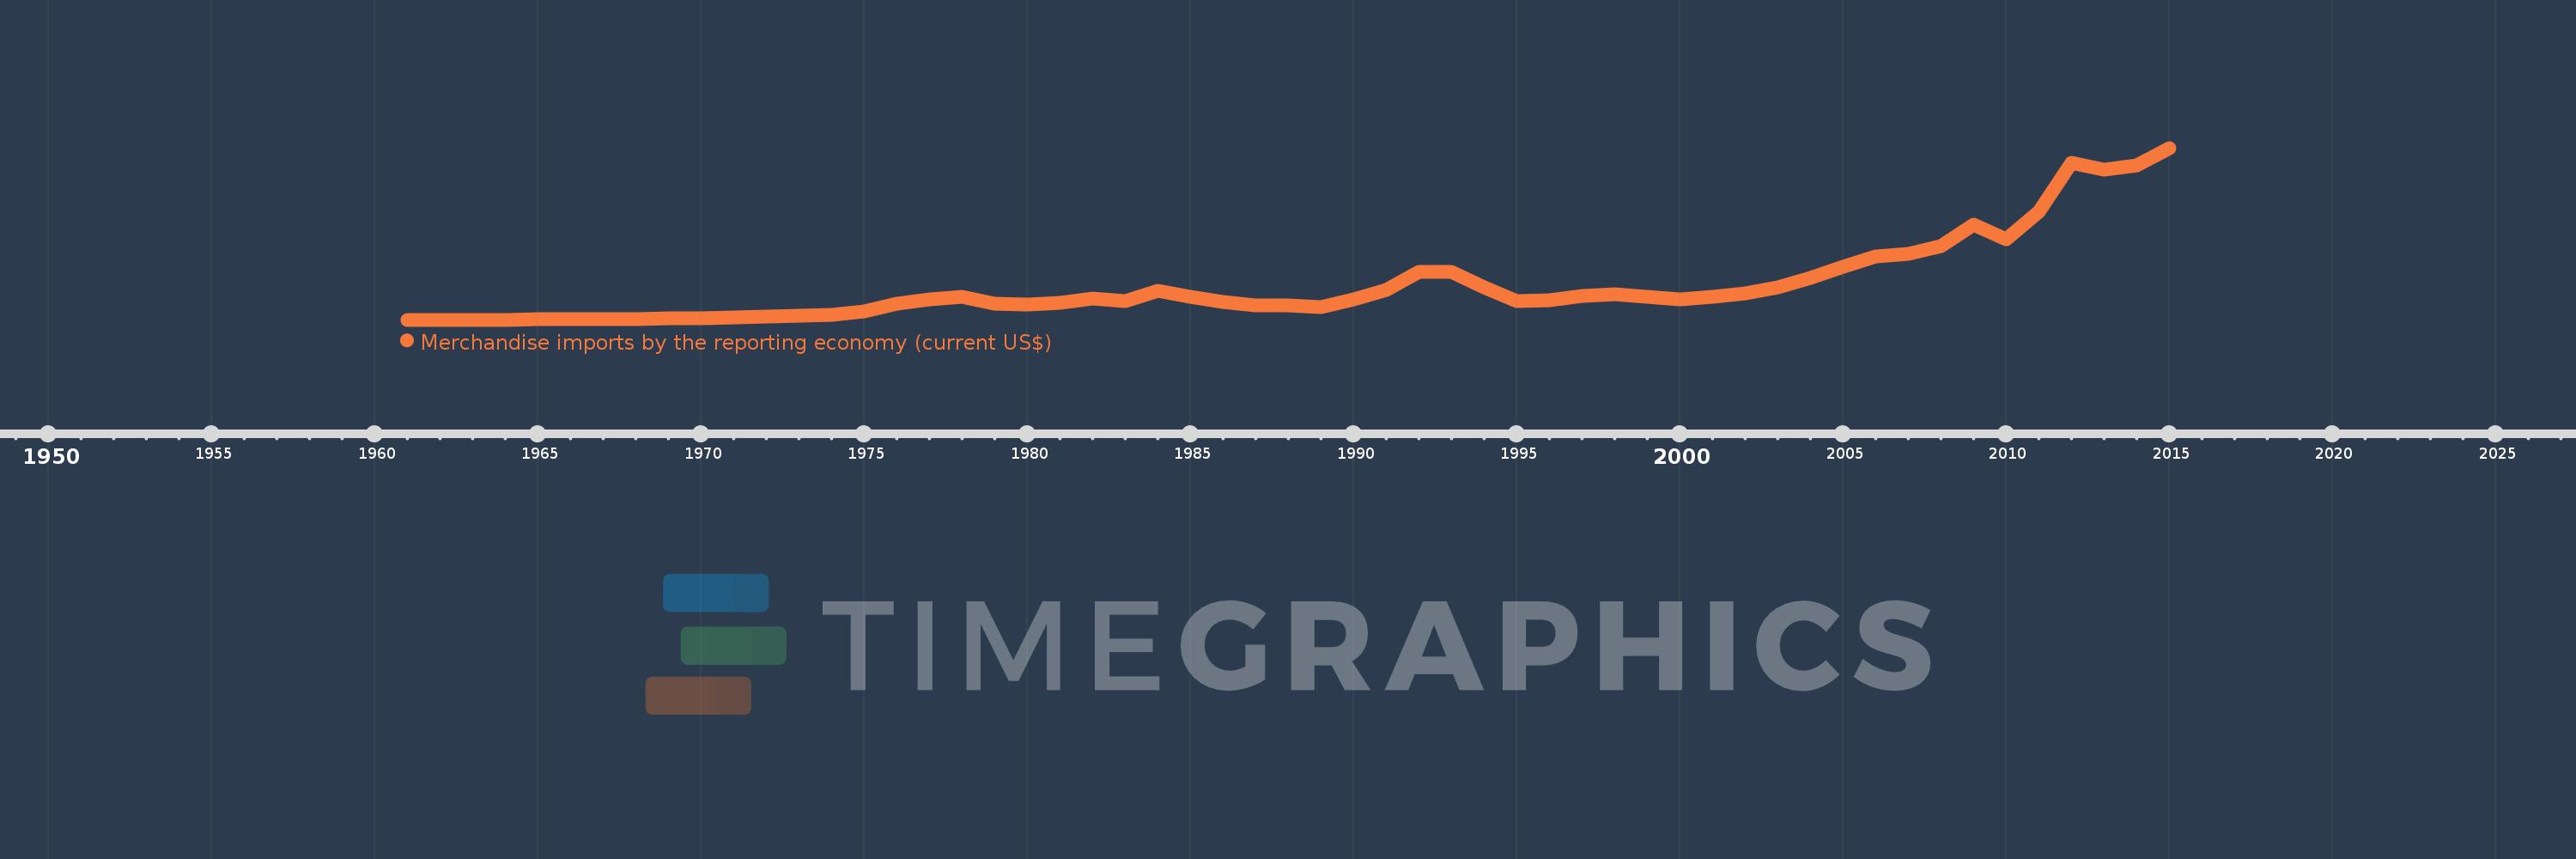
Merchandise imports by the reporting economy (current US$)
2015,2014,2013,2012,2011,2010,2009,2008,2007,2006,2005,2004,2003,2002,2001,2000,1999,1998,1997,1996,1995,1994,1993,1992,1991,1990,1989,1988,1987,1986,1985,1984,1983,1982,1981,1980,1979,1978,1977,1976,1975,1974,1970,1969,1968,1967,1966,1965,1964,1963,1962,1961
This statistics in other country:
AfghanistanAlbaniaAlgeriaAmerican SamoaAngolaAntigua and BarbudaArab WorldArgentinaArmeniaArubaAustraliaAustriaAzerbaijanBahamas, TheBahrainBangladeshBarbadosBelarusBelgiumBelizeBeninBermudaBoliviaBosnia and HerzegovinaBrazilBrunei DarussalamBulgariaBurkina FasoBurundiCabo VerdeCambodiaCameroonCanadaCaribbean small statesCentral African RepublicCentral Europe and the BalticsChadChileChinaColombiaComorosCongo, Dem. Rep.Congo, Rep.Costa RicaCote d'IvoireCroatiaCubaCyprusCzech RepublicDenmarkDjiboutiDominicaDominican RepublicEarly-demographic dividendEast Asia & PacificEast Asia & Pacific (excluding high income)East Asia & Pacific (IDA & IBRD countries)EcuadorEgypt, Arab Rep.El SalvadorEquatorial GuineaEstoniaEthiopiaEuro areaEurope & Central AsiaEurope & Central Asia (excluding high income)Europe & Central Asia (IDA & IBRD countries)European UnionFaroe IslandsFijiFinlandFragile and conflict affected situationsFranceFrench PolynesiaGabonGambia, TheGeorgiaGermanyGhanaGibraltarGreeceGreenlandGrenadaGuamGuatemalaGuineaGuinea-BissauGuyanaHaitiHeavily indebted poor countries (HIPC)High incomeHondurasHong Kong SAR, ChinaHungaryIBRD onlyIcelandIDA & IBRD totalIDA blendIDA onlyIDA totalIndiaIndonesiaIran, Islamic Rep.IraqIrelandIsraelItalyJamaicaJapanJordanKazakhstanKenyaKiribatiKorea, Dem. People’s Rep.Korea, Rep.KosovoKuwaitKyrgyz RepublicLao PDRLate-demographic dividendLatin America & Caribbean Latin America & Caribbean (excluding high income)Latin America & the Caribbean (IDA & IBRD countries)LatviaLeast developed countries: UN classificationLebanonLiberiaLibyaLithuaniaLow & middle incomeLow incomeLower middle incomeLuxembourgMacao SAR, ChinaMacedonia, FYRMadagascarMalawiMalaysiaMaldivesMaliMaltaMauritaniaMauritiusMexicoMiddle East & North AfricaMiddle East & North Africa (excluding high income)Middle East & North Africa (IDA & IBRD countries)Middle incomeMoldovaMongoliaMontenegroMoroccoMozambiqueMyanmarNauruNepalNetherlandsNew CaledoniaNew ZealandNicaraguaNigerNigeriaNorth AmericaNorwayOECD membersOmanOther small statesPacific island small statesPakistanPanamaPapua New GuineaParaguayPeruPhilippinesPolandPortugalPost-demographic dividendPre-demographic dividendQatarRomaniaRussian FederationRwandaSamoaSao Tome and PrincipeSaudi ArabiaSenegalSerbiaSeychellesSierra LeoneSingaporeSlovak RepublicSloveniaSmall statesSolomon IslandsSomaliaSouth AfricaSouth AsiaSouth Asia (IDA & IBRD)SpainSri LankaSt. Kitts and NevisSt. LuciaSt. Vincent and the GrenadinesSub-Saharan Africa Sub-Saharan Africa (excluding high income)Sub-Saharan Africa (IDA & IBRD countries)SudanSurinameSwedenSwitzerlandSyrian Arab RepublicTajikistanTanzaniaThailandTogoTongaTrinidad and TobagoTunisiaTurkeyTurkmenistanTuvaluUgandaUkraineUnited Arab EmiratesUnited KingdomUnited StatesUpper middle incomeUruguayUzbekistanVanuatuVenezuela, RBVietnamWorldYemen, Rep.ZambiaZimbabwe Timeline:
This timeline shows a graph from 1961 to 2015 of Iran, Islamic Rep.. No data until 1960. Number of actual observations by date: 52.
Source name:
World Development Indicators
Source organization:
World Bank staff estimates based data from International Monetary Fund's Direction of Trade database.
Categories, topics:
Private Sector, Trade
Last updated:
apr 23, 2017
Indicators value changes by year
Minimum:
520.0 mln
jan 1, 1964
Maximum:
105.159 bln
jan 1, 2015
At the date of observation
Value
Absolute change
Change from previous value
jan 1, 1961
556.9 mln
+556.9 mln
0.0%
jan 1, 1962
601.5 mln
+44.6 mln
8.01%
jan 1, 1963
520.6 mln
-80.9 mln
-13.45%
jan 1, 1964
520.0 mln
-600.0K
-0.12%
jan 1, 1965
668.9 mln
+148.9 mln
28.63%
jan 1, 1966
855.3 mln
+186.4 mln
27.87%
jan 1, 1967
933.6 mln
+78.3 mln
9.15%
jan 1, 1968
1.124 bln
+190.3 mln
20.38%
jan 1, 1969
1.393 bln
+269.1 mln
23.94%
jan 1, 1970
1.384 bln
-8.6 mln
-0.62%
jan 1, 1974
3.379 bln
+1.995 bln
144.08%
jan 1, 1975
5.426 bln
+2.047 bln
60.57%
jan 1, 1976
10.346 bln
+4.92 bln
90.68%
jan 1, 1977
12.887 bln
+2.541 bln
24.56%
jan 1, 1978
14.642 bln
+1.755 bln
13.62%
jan 1, 1979
10.372 bln
-4.27 bln
-29.16%
jan 1, 1980
9.695 bln
-677.0 mln
-6.53%
jan 1, 1981
10.849 bln
+1.154 bln
11.9%
jan 1, 1982
13.515 bln
+2.666 bln
24.57%
jan 1, 1983
11.845 bln
-1.67 bln
-12.36%
jan 1, 1984
18.103 bln
+6.258 bln
52.83%
jan 1, 1985
14.494 bln
-3.609 bln
-19.94%
jan 1, 1986
11.408 bln
-3.086 bln
-21.29%
jan 1, 1987
9.355 bln
-2.053 bln
-18.0%
jan 1, 1988
9.369 bln
+14.0 mln
0.15%
jan 1, 1989
8.171 bln
-1.198 bln
-12.79%
jan 1, 1990
12.807 bln
+4.636 bln
56.74%
jan 1, 1991
18.722 bln
+5.915 bln
46.18%
jan 1, 1992
29.677 bln
+10.956 bln
58.52%
jan 1, 1993
29.87 bln
+192.5 mln
0.65%
jan 1, 1994
20.037 bln
-9.833 bln
-32.92%
jan 1, 1995
11.795 bln
-8.242 bln
-41.13%
jan 1, 1996
12.313 bln
+518.0 mln
4.39%
jan 1, 1997
15.117 bln
+2.804 bln
22.77%
jan 1, 1998
15.908 bln
+790.8 mln
5.23%
jan 1, 1999
14.323 bln
-1.585 bln
-9.96%
jan 1, 2000
12.683 bln
-1.64 bln
-11.45%
jan 1, 2001
14.347 bln
+1.664 bln
13.12%
jan 1, 2002
16.485 bln
+2.138 bln
14.9%
jan 1, 2003
20.438 bln
+3.953 bln
23.98%
jan 1, 2004
26.002 bln
+5.564 bln
27.22%
jan 1, 2005
33.013 bln
+7.011 bln
26.96%
jan 1, 2006
38.904 bln
+5.891 bln
17.84%
jan 1, 2007
40.686 bln
+1.782 bln
4.58%
jan 1, 2008
45.168 bln
+4.482 bln
11.02%
jan 1, 2009
58.343 bln
+13.175 bln
29.17%
jan 1, 2010
49.74 bln
-8.602 bln
-14.74%
jan 1, 2011
66.395 bln
+16.655 bln
33.48%
jan 1, 2012
95.954 bln
+29.559 bln
44.52%
jan 1, 2013
92.052 bln
-3.902 bln
-4.07%
jan 1, 2014
94.701 bln
+2.649 bln
2.88%
jan 1, 2015
105.159 bln
+10.458 bln
11.04%
Ranking of countries by current statistics by years


Comments: