29
/
en
AIzaSyAYiBZKx7MnpbEhh9jyipgxe19OcubqV5w
April 1, 2024
134365
France
FRA
true
2
1
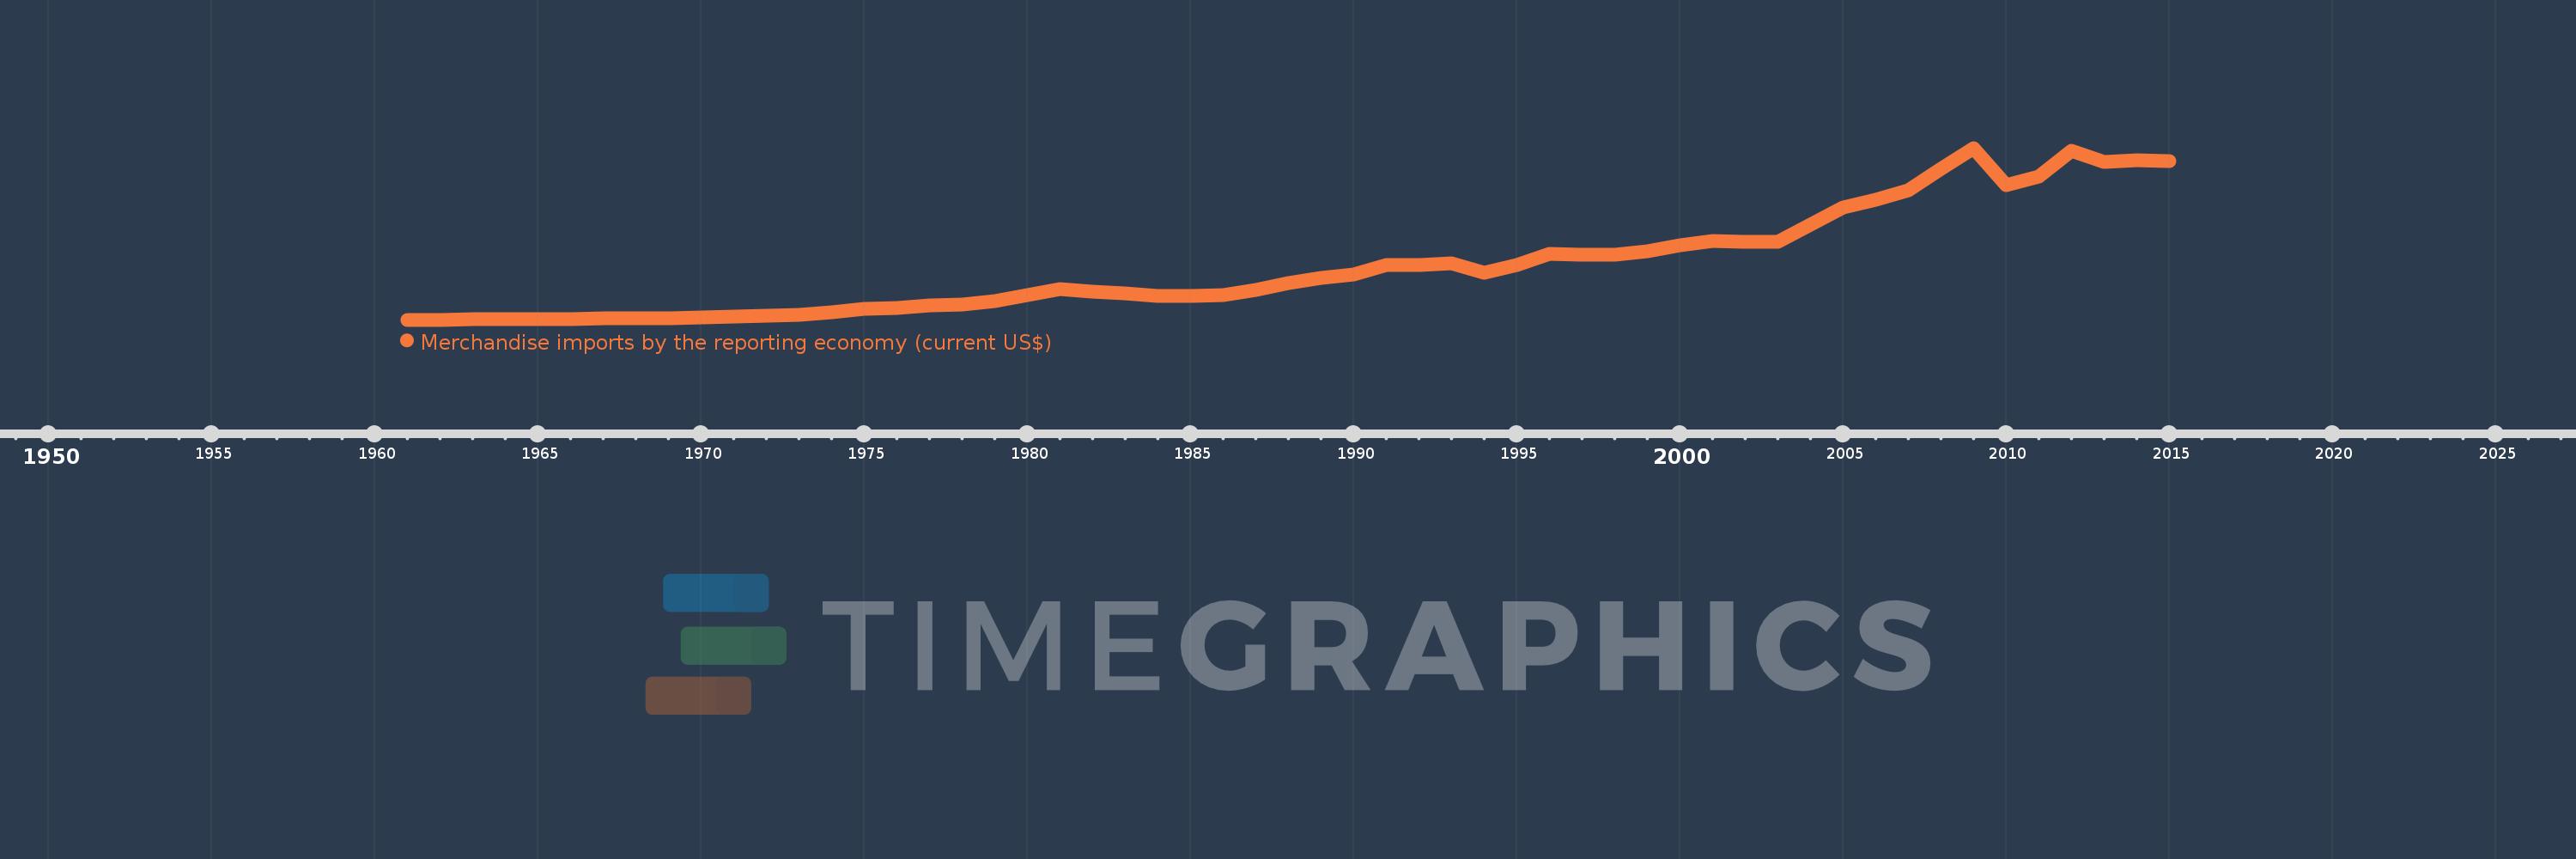
Merchandise imports by the reporting economy (current US$)
2015,2014,2013,2012,2011,2010,2009,2008,2007,2006,2005,2004,2003,2002,2001,2000,1999,1998,1997,1996,1995,1994,1993,1992,1991,1990,1989,1988,1987,1986,1985,1984,1983,1982,1981,1980,1979,1978,1977,1976,1975,1974,1973,1972,1971,1970,1969,1968,1967,1966,1965,1964,1963,1962,1961
This statistics in other country:
AfghanistanAlbaniaAlgeriaAmerican SamoaAngolaAntigua and BarbudaArab WorldArgentinaArmeniaArubaAustraliaAustriaAzerbaijanBahamas, TheBahrainBangladeshBarbadosBelarusBelgiumBelizeBeninBermudaBoliviaBosnia and HerzegovinaBrazilBrunei DarussalamBulgariaBurkina FasoBurundiCabo VerdeCambodiaCameroonCanadaCaribbean small statesCentral African RepublicCentral Europe and the BalticsChadChileChinaColombiaComorosCongo, Dem. Rep.Congo, Rep.Costa RicaCote d'IvoireCroatiaCubaCyprusCzech RepublicDenmarkDjiboutiDominicaDominican RepublicEarly-demographic dividendEast Asia & PacificEast Asia & Pacific (excluding high income)East Asia & Pacific (IDA & IBRD countries)EcuadorEgypt, Arab Rep.El SalvadorEquatorial GuineaEstoniaEthiopiaEuro areaEurope & Central AsiaEurope & Central Asia (excluding high income)Europe & Central Asia (IDA & IBRD countries)European UnionFaroe IslandsFijiFinlandFragile and conflict affected situationsFranceFrench PolynesiaGabonGambia, TheGeorgiaGermanyGhanaGibraltarGreeceGreenlandGrenadaGuamGuatemalaGuineaGuinea-BissauGuyanaHaitiHeavily indebted poor countries (HIPC)High incomeHondurasHong Kong SAR, ChinaHungaryIBRD onlyIcelandIDA & IBRD totalIDA blendIDA onlyIDA totalIndiaIndonesiaIran, Islamic Rep.IraqIrelandIsraelItalyJamaicaJapanJordanKazakhstanKenyaKiribatiKorea, Dem. People’s Rep.Korea, Rep.KosovoKuwaitKyrgyz RepublicLao PDRLate-demographic dividendLatin America & Caribbean Latin America & Caribbean (excluding high income)Latin America & the Caribbean (IDA & IBRD countries)LatviaLeast developed countries: UN classificationLebanonLiberiaLibyaLithuaniaLow & middle incomeLow incomeLower middle incomeLuxembourgMacao SAR, ChinaMacedonia, FYRMadagascarMalawiMalaysiaMaldivesMaliMaltaMauritaniaMauritiusMexicoMiddle East & North AfricaMiddle East & North Africa (excluding high income)Middle East & North Africa (IDA & IBRD countries)Middle incomeMoldovaMongoliaMontenegroMoroccoMozambiqueMyanmarNauruNepalNetherlandsNew CaledoniaNew ZealandNicaraguaNigerNigeriaNorth AmericaNorwayOECD membersOmanOther small statesPacific island small statesPakistanPanamaPapua New GuineaParaguayPeruPhilippinesPolandPortugalPost-demographic dividendPre-demographic dividendQatarRomaniaRussian FederationRwandaSamoaSao Tome and PrincipeSaudi ArabiaSenegalSerbiaSeychellesSierra LeoneSingaporeSlovak RepublicSloveniaSmall statesSolomon IslandsSomaliaSouth AfricaSouth AsiaSouth Asia (IDA & IBRD)SpainSri LankaSt. Kitts and NevisSt. LuciaSt. Vincent and the GrenadinesSub-Saharan Africa Sub-Saharan Africa (excluding high income)Sub-Saharan Africa (IDA & IBRD countries)SudanSurinameSwedenSwitzerlandSyrian Arab RepublicTajikistanTanzaniaThailandTogoTongaTrinidad and TobagoTunisiaTurkeyTurkmenistanTuvaluUgandaUkraineUnited Arab EmiratesUnited KingdomUnited StatesUpper middle incomeUruguayUzbekistanVanuatuVenezuela, RBVietnamWorldYemen, Rep.ZambiaZimbabwe Timeline:
This timeline shows a graph from 1961 to 2015 of France. No data until 1960. Number of actual observations by date: 55.
Source name:
World Development Indicators
Source organization:
World Bank staff estimates based data from International Monetary Fund's Direction of Trade database.
Categories, topics:
Private Sector, Trade
Last updated:
apr 23, 2017
Indicators value changes by year
Minimum:
6.154 bln
jan 1, 1961
Maximum:
717.888 bln
jan 1, 2009
At the date of observation
Value
Absolute change
Change from previous value
jan 1, 1961
6.154 bln
+6.154 bln
0.0%
jan 1, 1962
6.569 bln
+414.4 mln
6.73%
jan 1, 1963
7.403 bln
+834.2 mln
12.7%
jan 1, 1964
8.608 bln
+1.205 bln
16.28%
jan 1, 1965
9.976 bln
+1.368 bln
15.89%
jan 1, 1966
10.252 bln
+275.8 mln
2.76%
jan 1, 1967
11.834 bln
+1.582 bln
15.43%
jan 1, 1968
12.362 bln
+528.9 mln
4.47%
jan 1, 1969
13.945 bln
+1.583 bln
12.8%
jan 1, 1970
17.46 bln
+3.515 bln
25.2%
jan 1, 1971
19.087 bln
+1.627 bln
9.32%
jan 1, 1972
21.237 bln
+2.15 bln
11.26%
jan 1, 1973
26.959 bln
+5.722 bln
26.94%
jan 1, 1974
37.666 bln
+10.707 bln
39.72%
jan 1, 1975
52.845 bln
+15.18 bln
40.3%
jan 1, 1976
53.919 bln
+1.074 bln
2.03%
jan 1, 1977
64.311 bln
+10.392 bln
19.27%
jan 1, 1978
70.417 bln
+6.106 bln
9.49%
jan 1, 1979
81.69 bln
+11.274 bln
16.01%
jan 1, 1980
106.893 bln
+25.203 bln
30.85%
jan 1, 1981
134.751 bln
+27.858 bln
26.06%
jan 1, 1982
120.854 bln
-13.897 bln
-10.31%
jan 1, 1983
115.652 bln
-5.202 bln
-4.3%
jan 1, 1984
105.865 bln
-9.787 bln
-8.46%
jan 1, 1985
104.295 bln
-1.57 bln
-1.48%
jan 1, 1986
108.205 bln
+3.91 bln
3.75%
jan 1, 1987
129.303 bln
+21.098 bln
19.5%
jan 1, 1988
158.375 bln
+29.072 bln
22.48%
jan 1, 1989
180.22 bln
+21.845 bln
13.79%
jan 1, 1990
192.903 bln
+12.684 bln
7.04%
jan 1, 1991
234.305 bln
+41.402 bln
21.46%
jan 1, 1992
231.762 bln
-2.543 bln
-1.09%
jan 1, 1993
241.3 bln
+9.538 bln
4.12%
jan 1, 1994
202.538 bln
-38.761 bln
-16.06%
jan 1, 1995
234.135 bln
+31.597 bln
15.6%
jan 1, 1996
278.111 bln
+43.976 bln
18.78%
jan 1, 1997
275.757 bln
-2.354 bln
-0.85%
jan 1, 1998
274.065 bln
-1.692 bln
-0.61%
jan 1, 1999
290.107 bln
+16.042 bln
5.85%
jan 1, 2000
313.49 bln
+23.383 bln
8.06%
jan 1, 2001
331.84 bln
+18.35 bln
5.85%
jan 1, 2002
328.593 bln
-3.247 bln
-0.98%
jan 1, 2003
328.309 bln
-283.277 mln
-0.09%
jan 1, 2004
398.662 bln
+70.353 bln
21.43%
jan 1, 2005
470.874 bln
+72.212 bln
18.11%
jan 1, 2006
503.796 bln
+32.922 bln
6.99%
jan 1, 2007
541.811 bln
+38.014 bln
7.55%
jan 1, 2008
631.529 bln
+89.718 bln
16.56%
jan 1, 2009
717.888 bln
+86.36 bln
13.67%
jan 1, 2010
563.473 bln
-154.416 bln
-21.51%
jan 1, 2011
599.304 bln
+35.831 bln
6.36%
jan 1, 2012
707.065 bln
+107.761 bln
17.98%
jan 1, 2013
661.166 bln
-45.899 bln
-6.49%
jan 1, 2014
665.273 bln
+4.107 bln
0.62%
jan 1, 2015
663.691 bln
-1.582 bln
-0.24%
Ranking of countries by current statistics by years


Comments: