29
/
en
AIzaSyAYiBZKx7MnpbEhh9jyipgxe19OcubqV5w
April 1, 2024
51124
Middle income
MIC
false
2
1
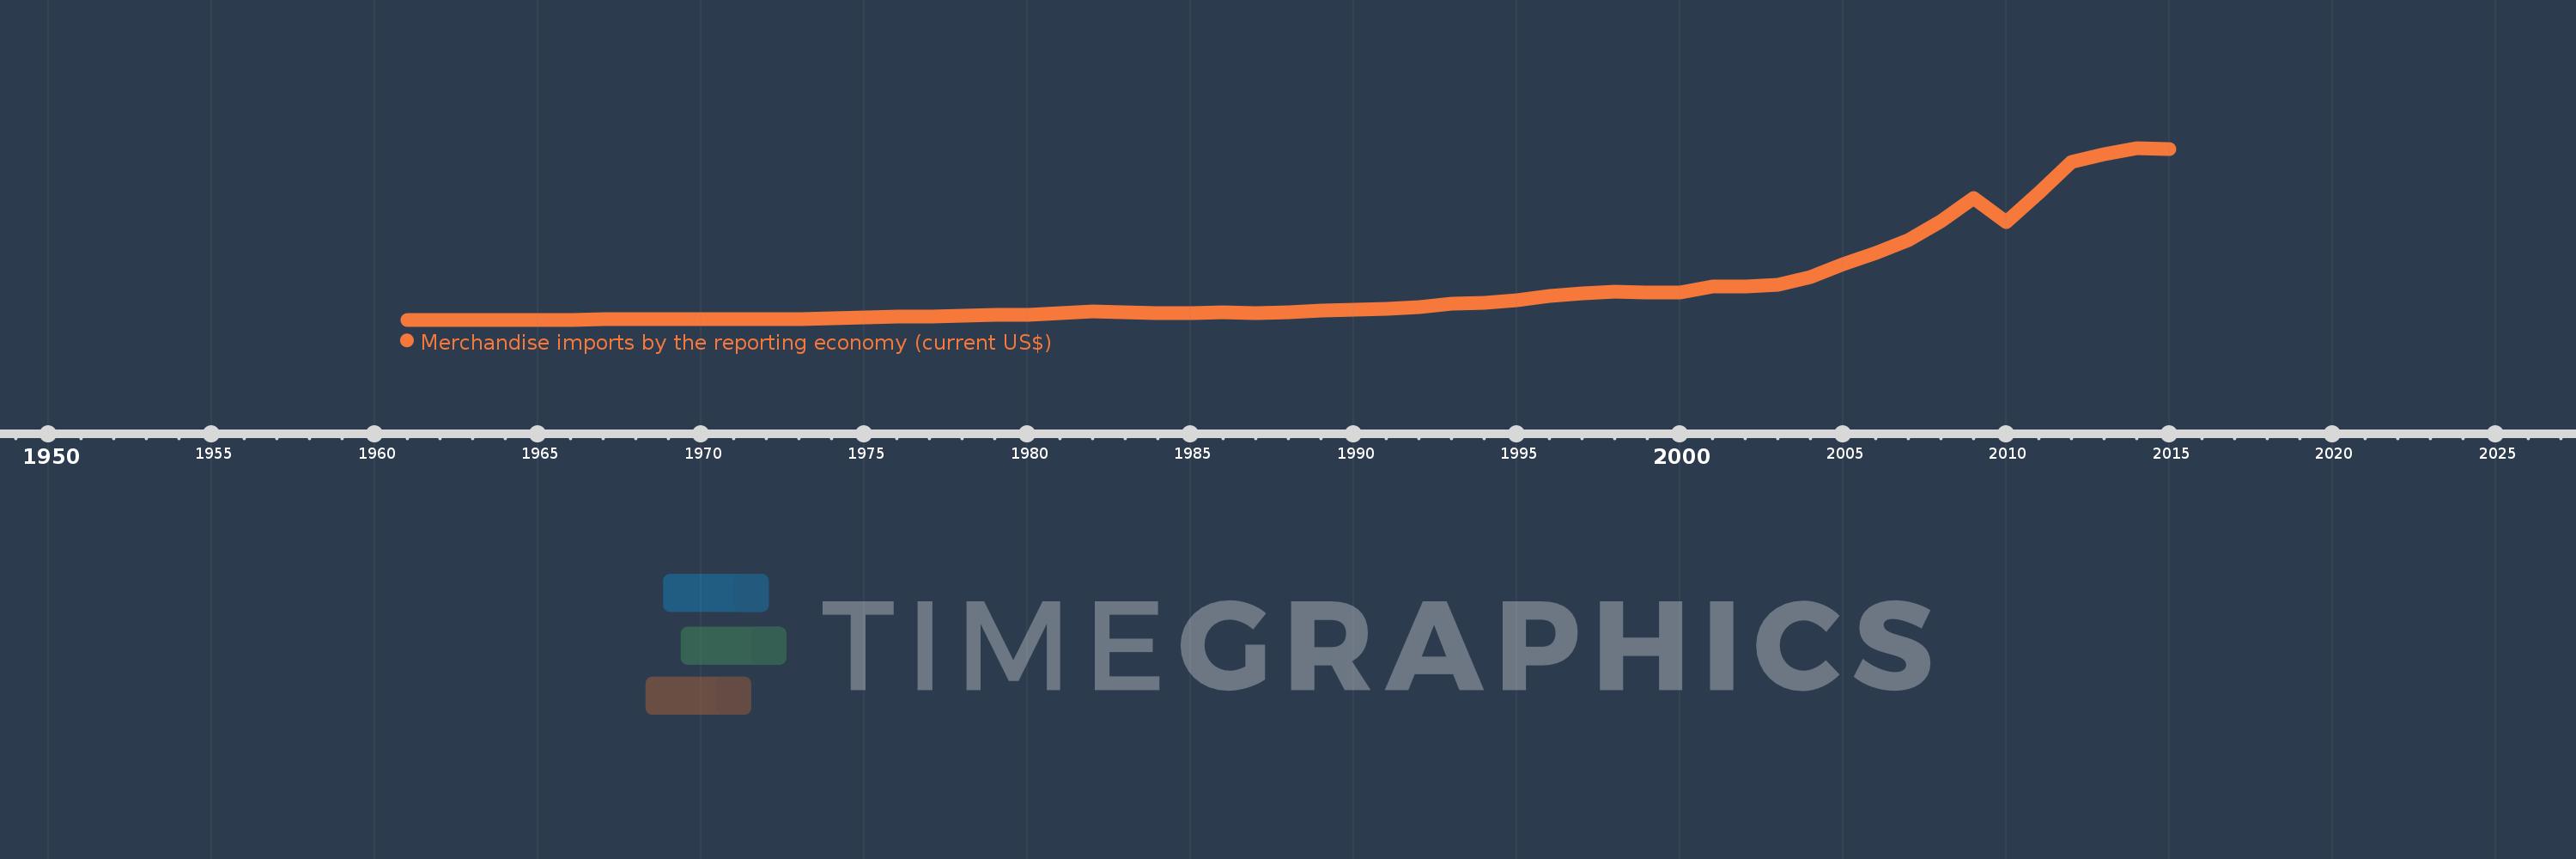
Merchandise imports by the reporting economy (current US$)
2015,2014,2013,2012,2011,2010,2009,2008,2007,2006,2005,2004,2003,2002,2001,2000,1999,1998,1997,1996,1995,1994,1993,1992,1991,1990,1989,1988,1987,1986,1985,1984,1983,1982,1981,1980,1979,1978,1977,1976,1975,1974,1973,1972,1971,1970,1969,1968,1967,1966,1965,1964,1963,1962,1961
This statistics in other country:
AfghanistanAlbaniaAlgeriaAmerican SamoaAngolaAntigua and BarbudaArab WorldArgentinaArmeniaArubaAustraliaAustriaAzerbaijanBahamas, TheBahrainBangladeshBarbadosBelarusBelgiumBelizeBeninBermudaBoliviaBosnia and HerzegovinaBrazilBrunei DarussalamBulgariaBurkina FasoBurundiCabo VerdeCambodiaCameroonCanadaCaribbean small statesCentral African RepublicCentral Europe and the BalticsChadChileChinaColombiaComorosCongo, Dem. Rep.Congo, Rep.Costa RicaCote d'IvoireCroatiaCubaCyprusCzech RepublicDenmarkDjiboutiDominicaDominican RepublicEarly-demographic dividendEast Asia & PacificEast Asia & Pacific (excluding high income)East Asia & Pacific (IDA & IBRD countries)EcuadorEgypt, Arab Rep.El SalvadorEquatorial GuineaEstoniaEthiopiaEuro areaEurope & Central AsiaEurope & Central Asia (excluding high income)Europe & Central Asia (IDA & IBRD countries)European UnionFaroe IslandsFijiFinlandFragile and conflict affected situationsFranceFrench PolynesiaGabonGambia, TheGeorgiaGermanyGhanaGibraltarGreeceGreenlandGrenadaGuamGuatemalaGuineaGuinea-BissauGuyanaHaitiHeavily indebted poor countries (HIPC)High incomeHondurasHong Kong SAR, ChinaHungaryIBRD onlyIcelandIDA & IBRD totalIDA blendIDA onlyIDA totalIndiaIndonesiaIran, Islamic Rep.IraqIrelandIsraelItalyJamaicaJapanJordanKazakhstanKenyaKiribatiKorea, Dem. People’s Rep.Korea, Rep.KosovoKuwaitKyrgyz RepublicLao PDRLate-demographic dividendLatin America & Caribbean Latin America & Caribbean (excluding high income)Latin America & the Caribbean (IDA & IBRD countries)LatviaLeast developed countries: UN classificationLebanonLiberiaLibyaLithuaniaLow & middle incomeLow incomeLower middle incomeLuxembourgMacao SAR, ChinaMacedonia, FYRMadagascarMalawiMalaysiaMaldivesMaliMaltaMauritaniaMauritiusMexicoMiddle East & North AfricaMiddle East & North Africa (excluding high income)Middle East & North Africa (IDA & IBRD countries)Middle incomeMoldovaMongoliaMontenegroMoroccoMozambiqueMyanmarNauruNepalNetherlandsNew CaledoniaNew ZealandNicaraguaNigerNigeriaNorth AmericaNorwayOECD membersOmanOther small statesPacific island small statesPakistanPanamaPapua New GuineaParaguayPeruPhilippinesPolandPortugalPost-demographic dividendPre-demographic dividendQatarRomaniaRussian FederationRwandaSamoaSao Tome and PrincipeSaudi ArabiaSenegalSerbiaSeychellesSierra LeoneSingaporeSlovak RepublicSloveniaSmall statesSolomon IslandsSomaliaSouth AfricaSouth AsiaSouth Asia (IDA & IBRD)SpainSri LankaSt. Kitts and NevisSt. LuciaSt. Vincent and the GrenadinesSub-Saharan Africa Sub-Saharan Africa (excluding high income)Sub-Saharan Africa (IDA & IBRD countries)SudanSurinameSwedenSwitzerlandSyrian Arab RepublicTajikistanTanzaniaThailandTogoTongaTrinidad and TobagoTunisiaTurkeyTurkmenistanTuvaluUgandaUkraineUnited Arab EmiratesUnited KingdomUnited StatesUpper middle incomeUruguayUzbekistanVanuatuVenezuela, RBVietnamWorldYemen, Rep.ZambiaZimbabwe Timeline:
This timeline shows a graph from 1961 to 2015 of Middle income. No data until 1960. Number of actual observations by date: 55.
Source name:
World Development Indicators
Source organization:
World Bank staff estimates based data from International Monetary Fund's Direction of Trade database.
Categories, topics:
Private Sector, Trade
Last updated:
apr 23, 2017
Indicators value changes by year
Minimum:
19.844 bln
jan 1, 1963
Maximum:
6.199 trl
jan 1, 2014
At the date of observation
Value
Absolute change
Change from previous value
jan 1, 1961
20.327 bln
+20.327 bln
0.0%
jan 1, 1962
21.531 bln
+1.204 bln
5.92%
jan 1, 1963
19.844 bln
-1.687 bln
-7.83%
jan 1, 1964
20.787 bln
+942.667 mln
4.75%
jan 1, 1965
23.819 bln
+3.033 bln
14.59%
jan 1, 1966
24.302 bln
+482.632 mln
2.03%
jan 1, 1967
26.645 bln
+2.343 bln
9.64%
jan 1, 1968
28.963 bln
+2.318 bln
8.7%
jan 1, 1969
31.09 bln
+2.127 bln
7.34%
jan 1, 1970
32.44 bln
+1.35 bln
4.34%
jan 1, 1971
35.081 bln
+2.641 bln
8.14%
jan 1, 1972
38.848 bln
+3.767 bln
10.74%
jan 1, 1973
43.874 bln
+5.025 bln
12.94%
jan 1, 1974
63.868 bln
+19.995 bln
45.57%
jan 1, 1975
103.741 bln
+39.872 bln
62.43%
jan 1, 1976
126.916 bln
+23.175 bln
22.34%
jan 1, 1977
131.972 bln
+5.056 bln
3.98%
jan 1, 1978
155.562 bln
+23.59 bln
17.88%
jan 1, 1979
183.018 bln
+27.456 bln
17.65%
jan 1, 1980
207.27 bln
+24.253 bln
13.25%
jan 1, 1981
260.382 bln
+53.112 bln
25.62%
jan 1, 1982
332.721 bln
+72.339 bln
27.78%
jan 1, 1983
299.459 bln
-33.262 bln
-10.0%
jan 1, 1984
270.693 bln
-28.766 bln
-9.61%
jan 1, 1985
268.507 bln
-2.187 bln
-0.81%
jan 1, 1986
275.399 bln
+6.892 bln
2.57%
jan 1, 1987
265.909 bln
-9.49 bln
-3.45%
jan 1, 1988
289.168 bln
+23.26 bln
8.75%
jan 1, 1989
335.048 bln
+45.88 bln
15.87%
jan 1, 1990
368.422 bln
+33.374 bln
9.96%
jan 1, 1991
424.786 bln
+56.364 bln
15.3%
jan 1, 1992
472.672 bln
+47.886 bln
11.27%
jan 1, 1993
592.546 bln
+119.874 bln
25.36%
jan 1, 1994
638.641 bln
+46.095 bln
7.78%
jan 1, 1995
730.429 bln
+91.788 bln
14.37%
jan 1, 1996
890.267 bln
+159.838 bln
21.88%
jan 1, 1997
953.578 bln
+63.311 bln
7.11%
jan 1, 1998
1.024 trl
+70.53 bln
7.4%
jan 1, 1999
996.406 bln
-27.702 bln
-2.7%
jan 1, 2000
1.008 trl
+11.774 bln
1.18%
jan 1, 2001
1.209 trl
+200.474 bln
19.88%
jan 1, 2002
1.203 trl
-5.729 bln
-0.47%
jan 1, 2003
1.289 trl
+86.331 bln
7.18%
jan 1, 2004
1.545 trl
+255.554 bln
19.82%
jan 1, 2005
2.017 trl
+472.538 bln
30.59%
jan 1, 2006
2.41 trl
+393.0 bln
19.48%
jan 1, 2007
2.889 trl
+478.236 bln
19.84%
jan 1, 2008
3.562 trl
+673.889 bln
23.33%
jan 1, 2009
4.411 trl
+848.591 bln
23.82%
jan 1, 2010
3.52 trl
-890.676 bln
-20.19%
jan 1, 2011
4.583 trl
+1.062 trl
30.18%
jan 1, 2012
5.702 trl
+1.119 trl
24.43%
jan 1, 2013
5.965 trl
+263.313 bln
4.62%
jan 1, 2014
6.199 trl
+233.086 bln
3.91%
jan 1, 2015
6.169 trl
-29.174 bln
-0.47%
Ranking of countries by current statistics by years


Comments: