29
/
en
AIzaSyAYiBZKx7MnpbEhh9jyipgxe19OcubqV5w
April 1, 2024
122422
Dominican Republic
DOM
true
2
1
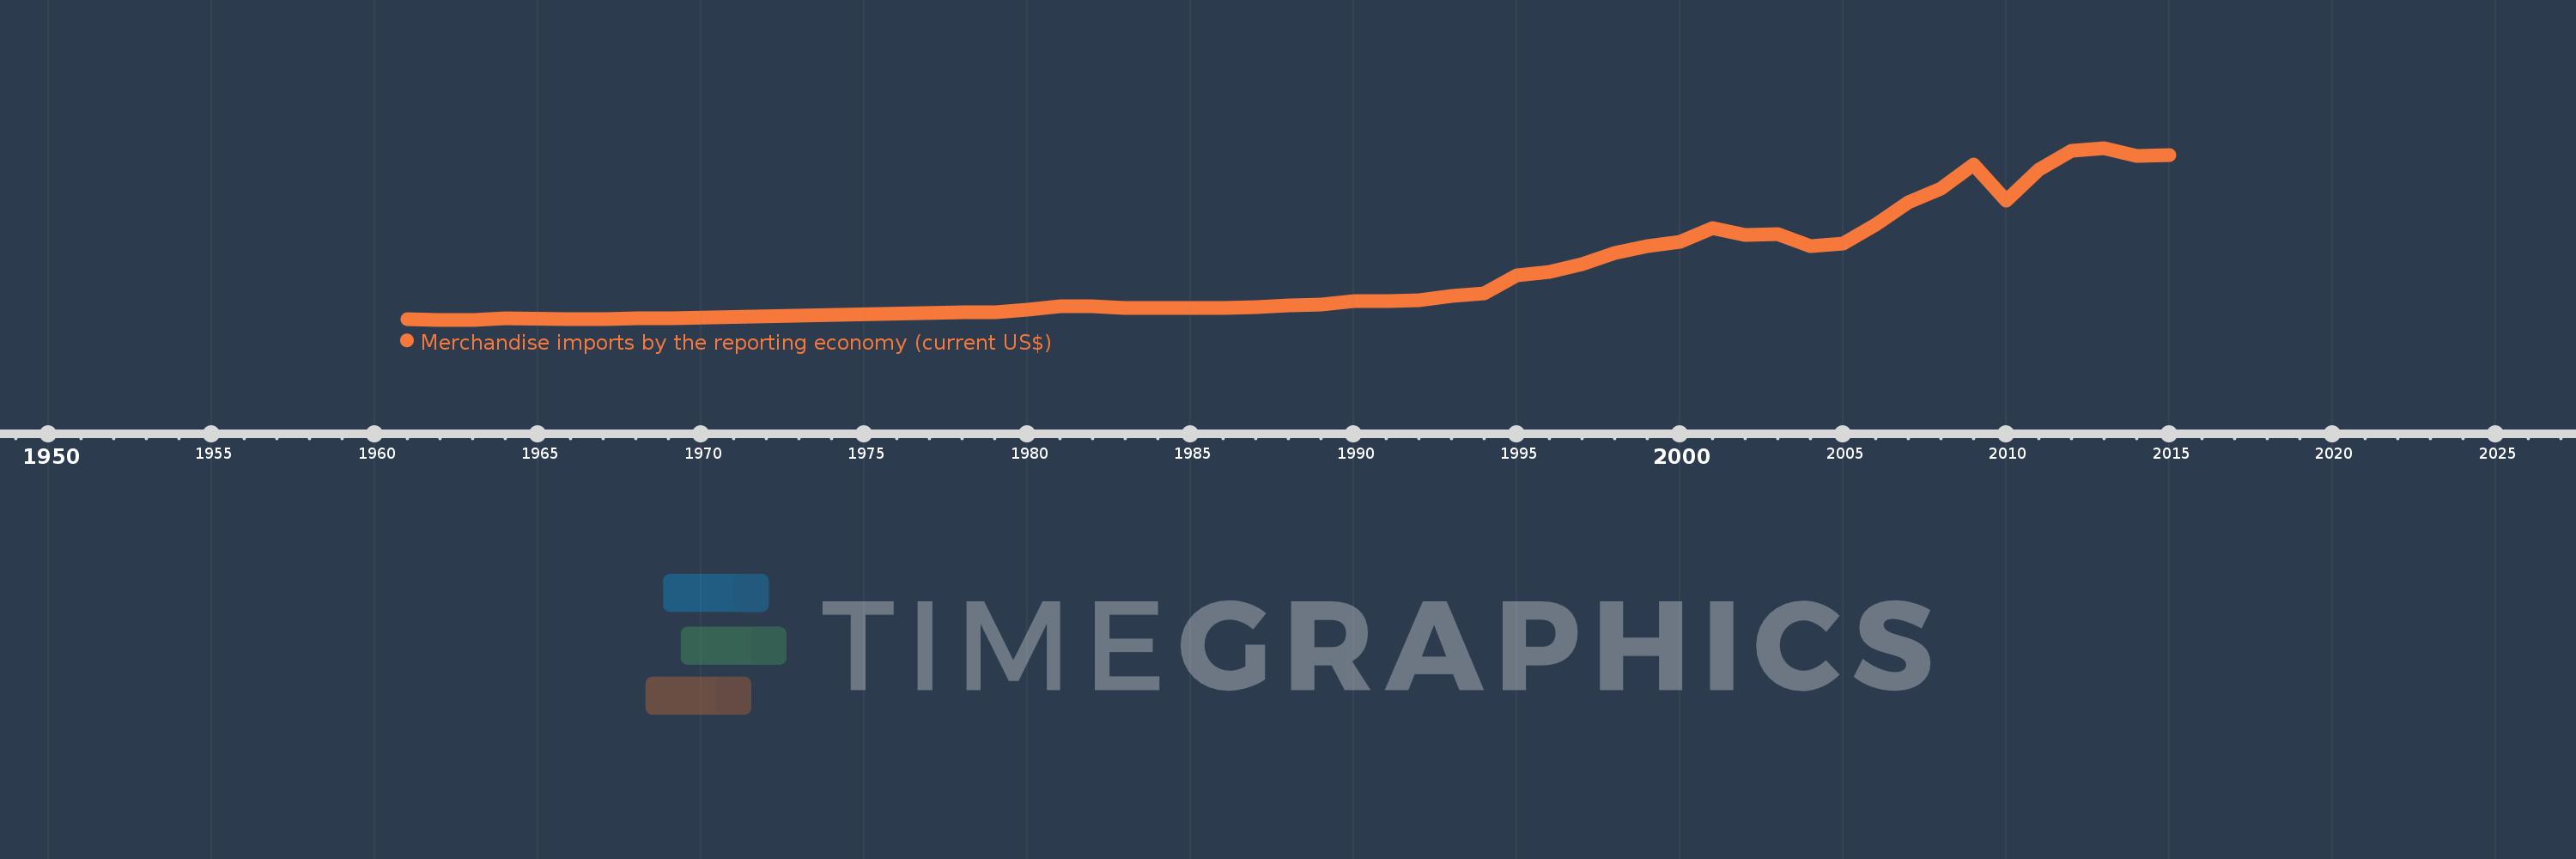
Merchandise imports by the reporting economy (current US$)
2015,2014,2013,2012,2011,2010,2009,2008,2007,2006,2005,2004,2003,2002,2001,2000,1999,1998,1997,1996,1995,1994,1993,1992,1991,1990,1989,1988,1987,1986,1985,1984,1983,1982,1981,1980,1979,1978,1969,1968,1967,1966,1964,1963,1962,1961
This statistics in other country:
AfghanistanAlbaniaAlgeriaAmerican SamoaAngolaAntigua and BarbudaArab WorldArgentinaArmeniaArubaAustraliaAustriaAzerbaijanBahamas, TheBahrainBangladeshBarbadosBelarusBelgiumBelizeBeninBermudaBoliviaBosnia and HerzegovinaBrazilBrunei DarussalamBulgariaBurkina FasoBurundiCabo VerdeCambodiaCameroonCanadaCaribbean small statesCentral African RepublicCentral Europe and the BalticsChadChileChinaColombiaComorosCongo, Dem. Rep.Congo, Rep.Costa RicaCote d'IvoireCroatiaCubaCyprusCzech RepublicDenmarkDjiboutiDominicaDominican RepublicEarly-demographic dividendEast Asia & PacificEast Asia & Pacific (excluding high income)East Asia & Pacific (IDA & IBRD countries)EcuadorEgypt, Arab Rep.El SalvadorEquatorial GuineaEstoniaEthiopiaEuro areaEurope & Central AsiaEurope & Central Asia (excluding high income)Europe & Central Asia (IDA & IBRD countries)European UnionFaroe IslandsFijiFinlandFragile and conflict affected situationsFranceFrench PolynesiaGabonGambia, TheGeorgiaGermanyGhanaGibraltarGreeceGreenlandGrenadaGuamGuatemalaGuineaGuinea-BissauGuyanaHaitiHeavily indebted poor countries (HIPC)High incomeHondurasHong Kong SAR, ChinaHungaryIBRD onlyIcelandIDA & IBRD totalIDA blendIDA onlyIDA totalIndiaIndonesiaIran, Islamic Rep.IraqIrelandIsraelItalyJamaicaJapanJordanKazakhstanKenyaKiribatiKorea, Dem. People’s Rep.Korea, Rep.KosovoKuwaitKyrgyz RepublicLao PDRLate-demographic dividendLatin America & Caribbean Latin America & Caribbean (excluding high income)Latin America & the Caribbean (IDA & IBRD countries)LatviaLeast developed countries: UN classificationLebanonLiberiaLibyaLithuaniaLow & middle incomeLow incomeLower middle incomeLuxembourgMacao SAR, ChinaMacedonia, FYRMadagascarMalawiMalaysiaMaldivesMaliMaltaMauritaniaMauritiusMexicoMiddle East & North AfricaMiddle East & North Africa (excluding high income)Middle East & North Africa (IDA & IBRD countries)Middle incomeMoldovaMongoliaMontenegroMoroccoMozambiqueMyanmarNauruNepalNetherlandsNew CaledoniaNew ZealandNicaraguaNigerNigeriaNorth AmericaNorwayOECD membersOmanOther small statesPacific island small statesPakistanPanamaPapua New GuineaParaguayPeruPhilippinesPolandPortugalPost-demographic dividendPre-demographic dividendQatarRomaniaRussian FederationRwandaSamoaSao Tome and PrincipeSaudi ArabiaSenegalSerbiaSeychellesSierra LeoneSingaporeSlovak RepublicSloveniaSmall statesSolomon IslandsSomaliaSouth AfricaSouth AsiaSouth Asia (IDA & IBRD)SpainSri LankaSt. Kitts and NevisSt. LuciaSt. Vincent and the GrenadinesSub-Saharan Africa Sub-Saharan Africa (excluding high income)Sub-Saharan Africa (IDA & IBRD countries)SudanSurinameSwedenSwitzerlandSyrian Arab RepublicTajikistanTanzaniaThailandTogoTongaTrinidad and TobagoTunisiaTurkeyTurkmenistanTuvaluUgandaUkraineUnited Arab EmiratesUnited KingdomUnited StatesUpper middle incomeUruguayUzbekistanVanuatuVenezuela, RBVietnamWorldYemen, Rep.ZambiaZimbabwe Timeline:
This timeline shows a graph from 1961 to 2015 of Dominican Republic. No data until 1960. Number of actual observations by date: 46.
Source name:
World Development Indicators
Source organization:
World Bank staff estimates based data from International Monetary Fund's Direction of Trade database.
Categories, topics:
Private Sector, Trade
Last updated:
apr 23, 2017
Indicators value changes by year
Minimum:
58.0 mln
jan 1, 1963
Maximum:
19.514 bln
jan 1, 2013
At the date of observation
Value
Absolute change
Change from previous value
jan 1, 1961
95.92 mln
+95.92 mln
0.0%
jan 1, 1962
76.34 mln
-19.58 mln
-20.41%
jan 1, 1963
58.0 mln
-18.34 mln
-24.02%
jan 1, 1964
175.06 mln
+117.06 mln
201.83%
jan 1, 1966
87.77 mln
-87.29 mln
-49.86%
jan 1, 1967
111.71 mln
+23.94 mln
27.28%
jan 1, 1968
192.07 mln
+80.36 mln
71.94%
jan 1, 1969
217.95 mln
+25.88 mln
13.47%
jan 1, 1978
925.73 mln
+707.78 mln
324.74%
jan 1, 1979
941.92 mln
+16.19 mln
1.75%
jan 1, 1980
1.161 bln
+219.34 mln
23.29%
jan 1, 1981
1.574 bln
+412.44 mln
35.52%
jan 1, 1982
1.556 bln
-17.68 mln
-1.12%
jan 1, 1983
1.375 bln
-180.8 mln
-11.62%
jan 1, 1984
1.405 bln
+30.23 mln
2.2%
jan 1, 1985
1.383 bln
-22.73 mln
-1.62%
jan 1, 1986
1.415 bln
+32.48 mln
2.35%
jan 1, 1987
1.504 bln
+88.96 mln
6.29%
jan 1, 1988
1.722 bln
+217.34 mln
14.45%
jan 1, 1989
1.769 bln
+47.3 mln
2.75%
jan 1, 1990
2.171 bln
+402.27 mln
22.74%
jan 1, 1991
2.194 bln
+23.095 mln
1.06%
jan 1, 1992
2.309 bln
+114.359 mln
5.21%
jan 1, 1993
2.727 bln
+418.251 mln
18.12%
jan 1, 1994
3.067 bln
+340.335 mln
12.48%
jan 1, 1995
5.13 bln
+2.062 bln
67.24%
jan 1, 1996
5.446 bln
+316.192 mln
6.16%
jan 1, 1997
6.304 bln
+858.71 mln
15.77%
jan 1, 1998
7.625 bln
+1.32 bln
20.94%
jan 1, 1999
8.353 bln
+728.054 mln
9.55%
jan 1, 2000
8.844 bln
+491.253 mln
5.88%
jan 1, 2001
10.426 bln
+1.582 bln
17.89%
jan 1, 2002
9.657 bln
-769.174 mln
-7.38%
jan 1, 2003
9.721 bln
+64.26 mln
0.67%
jan 1, 2004
8.389 bln
-1.332 bln
-13.7%
jan 1, 2005
8.677 bln
+287.362 mln
3.43%
jan 1, 2006
10.856 bln
+2.18 bln
25.12%
jan 1, 2007
13.391 bln
+2.535 bln
23.35%
jan 1, 2008
14.956 bln
+1.565 bln
11.68%
jan 1, 2009
17.593 bln
+2.637 bln
17.63%
jan 1, 2010
13.526 bln
-4.067 bln
-23.12%
jan 1, 2011
17.038 bln
+3.513 bln
25.97%
jan 1, 2012
19.15 bln
+2.111 bln
12.39%
jan 1, 2013
19.514 bln
+364.252 mln
1.9%
jan 1, 2014
18.56 bln
-953.295 mln
-4.89%
jan 1, 2015
18.662 bln
+101.115 mln
0.54%
Ranking of countries by current statistics by years


Comments: