29
/
en
AIzaSyAYiBZKx7MnpbEhh9jyipgxe19OcubqV5w
April 1, 2024
254359
Suriname
SUR
true
2
1
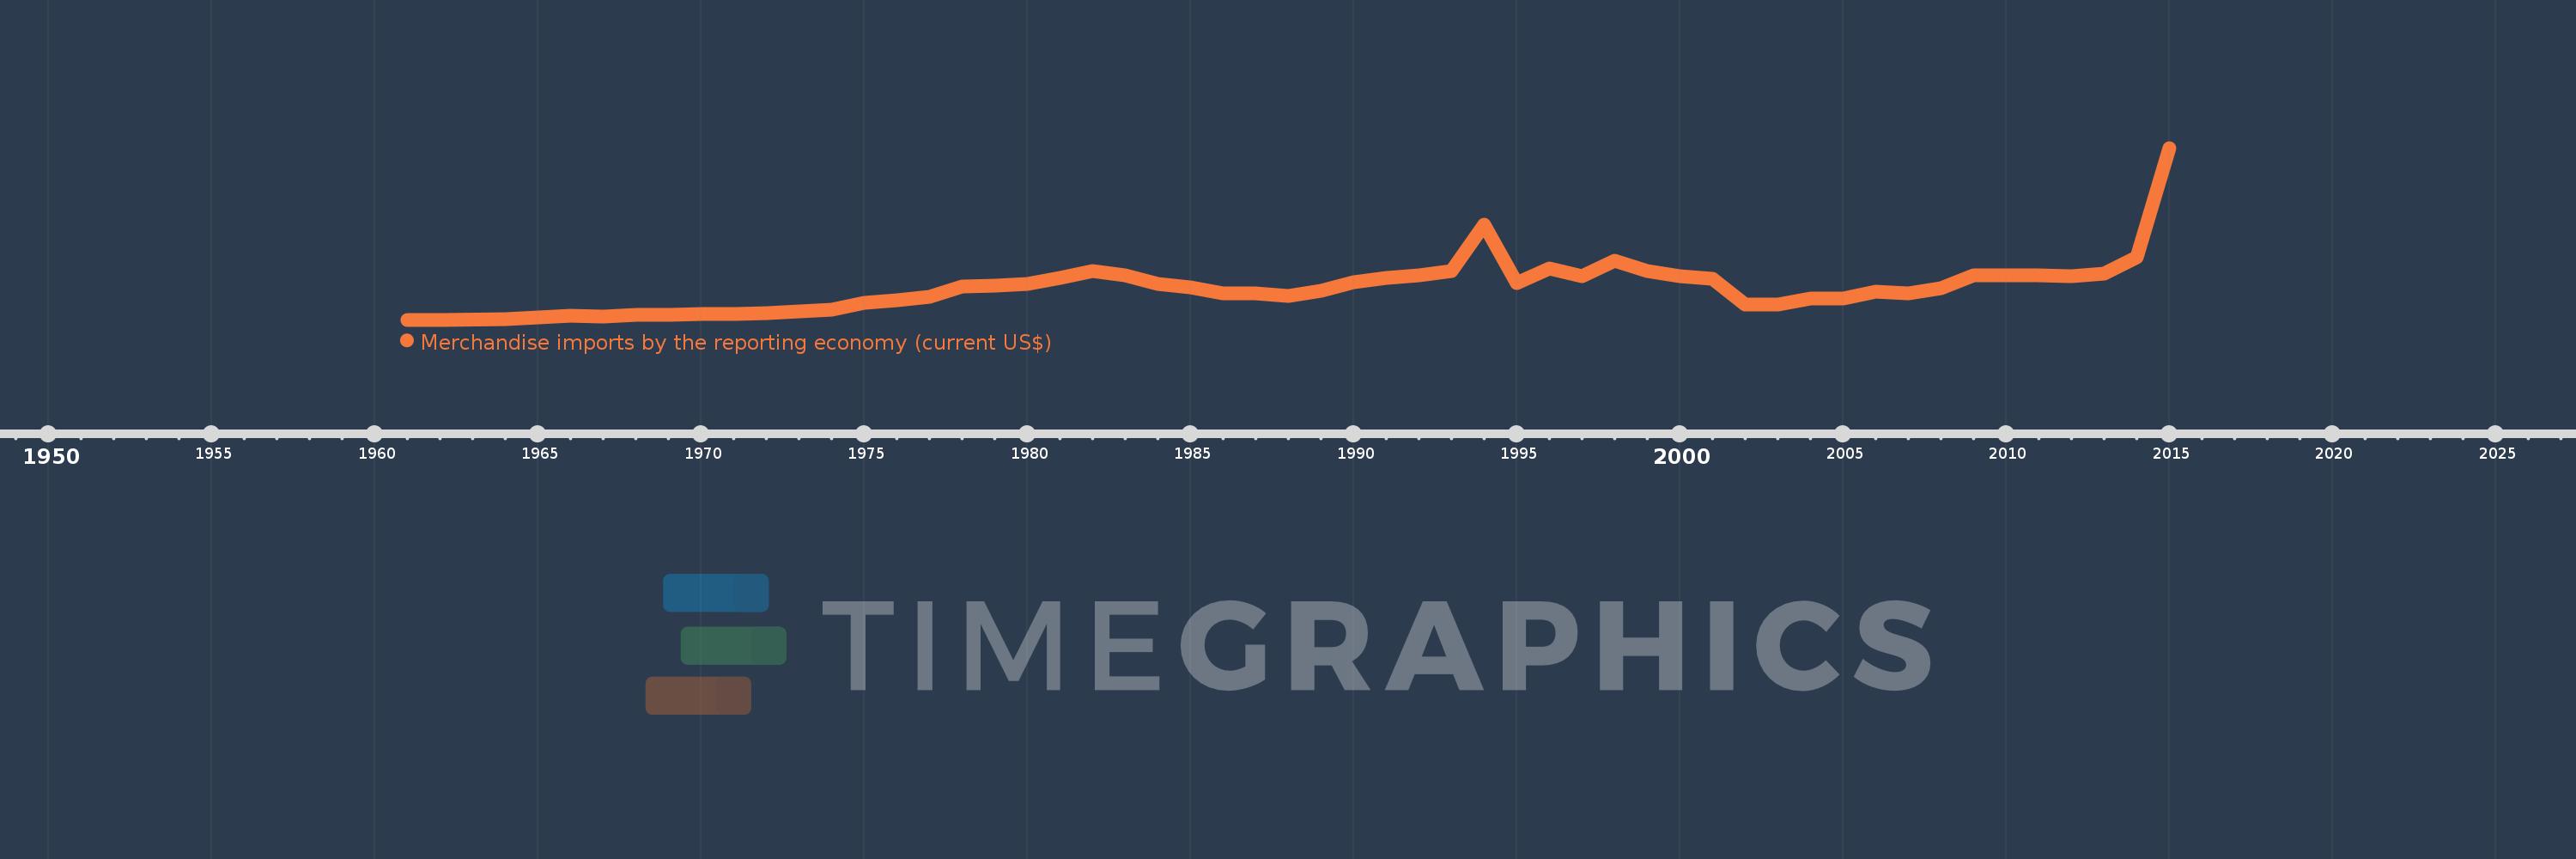
Merchandise imports by the reporting economy (current US$)
2015,2014,2013,2012,2011,2010,2009,2008,2007,2006,2005,2004,2003,2002,2001,2000,1999,1998,1997,1996,1995,1994,1993,1992,1991,1990,1989,1988,1987,1986,1985,1984,1983,1982,1981,1980,1979,1978,1977,1976,1975,1974,1973,1972,1971,1970,1969,1968,1967,1966,1965,1964,1962,1961
This statistics in other country:
AfghanistanAlbaniaAlgeriaAmerican SamoaAngolaAntigua and BarbudaArab WorldArgentinaArmeniaArubaAustraliaAustriaAzerbaijanBahamas, TheBahrainBangladeshBarbadosBelarusBelgiumBelizeBeninBermudaBoliviaBosnia and HerzegovinaBrazilBrunei DarussalamBulgariaBurkina FasoBurundiCabo VerdeCambodiaCameroonCanadaCaribbean small statesCentral African RepublicCentral Europe and the BalticsChadChileChinaColombiaComorosCongo, Dem. Rep.Congo, Rep.Costa RicaCote d'IvoireCroatiaCubaCyprusCzech RepublicDenmarkDjiboutiDominicaDominican RepublicEarly-demographic dividendEast Asia & PacificEast Asia & Pacific (excluding high income)East Asia & Pacific (IDA & IBRD countries)EcuadorEgypt, Arab Rep.El SalvadorEquatorial GuineaEstoniaEthiopiaEuro areaEurope & Central AsiaEurope & Central Asia (excluding high income)Europe & Central Asia (IDA & IBRD countries)European UnionFaroe IslandsFijiFinlandFragile and conflict affected situationsFranceFrench PolynesiaGabonGambia, TheGeorgiaGermanyGhanaGibraltarGreeceGreenlandGrenadaGuamGuatemalaGuineaGuinea-BissauGuyanaHaitiHeavily indebted poor countries (HIPC)High incomeHondurasHong Kong SAR, ChinaHungaryIBRD onlyIcelandIDA & IBRD totalIDA blendIDA onlyIDA totalIndiaIndonesiaIran, Islamic Rep.IraqIrelandIsraelItalyJamaicaJapanJordanKazakhstanKenyaKiribatiKorea, Dem. People’s Rep.Korea, Rep.KosovoKuwaitKyrgyz RepublicLao PDRLate-demographic dividendLatin America & Caribbean Latin America & Caribbean (excluding high income)Latin America & the Caribbean (IDA & IBRD countries)LatviaLeast developed countries: UN classificationLebanonLiberiaLibyaLithuaniaLow & middle incomeLow incomeLower middle incomeLuxembourgMacao SAR, ChinaMacedonia, FYRMadagascarMalawiMalaysiaMaldivesMaliMaltaMauritaniaMauritiusMexicoMiddle East & North AfricaMiddle East & North Africa (excluding high income)Middle East & North Africa (IDA & IBRD countries)Middle incomeMoldovaMongoliaMontenegroMoroccoMozambiqueMyanmarNauruNepalNetherlandsNew CaledoniaNew ZealandNicaraguaNigerNigeriaNorth AmericaNorwayOECD membersOmanOther small statesPacific island small statesPakistanPanamaPapua New GuineaParaguayPeruPhilippinesPolandPortugalPost-demographic dividendPre-demographic dividendQatarRomaniaRussian FederationRwandaSamoaSao Tome and PrincipeSaudi ArabiaSenegalSerbiaSeychellesSierra LeoneSingaporeSlovak RepublicSloveniaSmall statesSolomon IslandsSomaliaSouth AfricaSouth AsiaSouth Asia (IDA & IBRD)SpainSri LankaSt. Kitts and NevisSt. LuciaSt. Vincent and the GrenadinesSub-Saharan Africa Sub-Saharan Africa (excluding high income)Sub-Saharan Africa (IDA & IBRD countries)SudanSurinameSwedenSwitzerlandSyrian Arab RepublicTajikistanTanzaniaThailandTogoTongaTrinidad and TobagoTunisiaTurkeyTurkmenistanTuvaluUgandaUkraineUnited Arab EmiratesUnited KingdomUnited StatesUpper middle incomeUruguayUzbekistanVanuatuVenezuela, RBVietnamWorldYemen, Rep.ZambiaZimbabwe Timeline:
This timeline shows a graph from 1961 to 2015 of Suriname. No data until 1960. Number of actual observations by date: 54.
Source name:
World Development Indicators
Source organization:
World Bank staff estimates based data from International Monetary Fund's Direction of Trade database.
Categories, topics:
Private Sector, Trade
Last updated:
apr 23, 2017
Indicators value changes by year
Minimum:
53.3 mln
jan 1, 1962
Maximum:
1.826 bln
jan 1, 2015
At the date of observation
Value
Absolute change
Change from previous value
jan 1, 1961
54.4 mln
+54.4 mln
0.0%
jan 1, 1962
53.3 mln
-1.1 mln
-2.02%
jan 1, 1964
58.8 mln
+5.5 mln
10.32%
jan 1, 1965
80.5 mln
+21.7 mln
36.9%
jan 1, 1966
95.2 mln
+14.7 mln
18.26%
jan 1, 1967
89.7 mln
-5.5 mln
-5.78%
jan 1, 1968
102.564 mln
+12.864 mln
14.34%
jan 1, 1969
99.953 mln
-2.611 mln
-2.55%
jan 1, 1970
110.06 mln
+10.107 mln
10.11%
jan 1, 1971
115.414 mln
+5.354 mln
4.86%
jan 1, 1972
125.92 mln
+10.506 mln
9.1%
jan 1, 1973
143.679 mln
+17.759 mln
14.1%
jan 1, 1974
157.147 mln
+13.468 mln
9.37%
jan 1, 1975
229.252 mln
+72.105 mln
45.88%
jan 1, 1976
253.599 mln
+24.347 mln
10.62%
jan 1, 1977
293.658 mln
+40.059 mln
15.8%
jan 1, 1978
395.859 mln
+102.201 mln
34.8%
jan 1, 1979
405.988 mln
+10.129 mln
2.56%
jan 1, 1980
426.262 mln
+20.274 mln
4.99%
jan 1, 1981
484.184 mln
+57.922 mln
13.59%
jan 1, 1982
554.702 mln
+70.518 mln
14.56%
jan 1, 1983
512.439 mln
-42.263 mln
-7.62%
jan 1, 1984
427.246 mln
-85.193 mln
-16.63%
jan 1, 1985
389.38 mln
-37.866 mln
-8.86%
jan 1, 1986
329.08 mln
-60.3 mln
-15.49%
jan 1, 1987
328.452 mln
-627.787K
-0.19%
jan 1, 1988
294.676 mln
-33.776 mln
-10.28%
jan 1, 1989
351.127 mln
+56.451 mln
19.16%
jan 1, 1990
442.844 mln
+91.717 mln
26.12%
jan 1, 1991
483.639 mln
+40.795 mln
9.21%
jan 1, 1992
513.984 mln
+30.345 mln
6.27%
jan 1, 1993
553.759 mln
+39.775 mln
7.74%
jan 1, 1994
1.031 bln
+477.669 mln
86.26%
jan 1, 1995
432.502 mln
-598.925 mln
-58.07%
jan 1, 1996
586.171 mln
+153.669 mln
35.53%
jan 1, 1997
501.564 mln
-84.607 mln
-14.43%
jan 1, 1998
658.141 mln
+156.577 mln
31.22%
jan 1, 1999
551.63 mln
-106.511 mln
-16.18%
jan 1, 2000
501.479 mln
-50.151 mln
-9.09%
jan 1, 2001
479.873 mln
-21.606 mln
-4.31%
jan 1, 2002
209.575 mln
-270.298 mln
-56.33%
jan 1, 2003
213.857 mln
+4.282 mln
2.04%
jan 1, 2004
270.579 mln
+56.722 mln
26.52%
jan 1, 2005
270.728 mln
+148.57K
0.05%
jan 1, 2006
339.69 mln
+68.962 mln
25.47%
jan 1, 2007
329.053 mln
-10.637 mln
-3.13%
jan 1, 2008
380.657 mln
+51.604 mln
15.68%
jan 1, 2009
512.557 mln
+131.9 mln
34.65%
jan 1, 2010
507.321 mln
-5.236 mln
-1.02%
jan 1, 2011
509.19 mln
+1.869 mln
0.37%
jan 1, 2012
501.442 mln
-7.748 mln
-1.52%
jan 1, 2013
525.229 mln
+23.787 mln
4.74%
jan 1, 2014
700.429 mln
+175.2 mln
33.36%
jan 1, 2015
1.826 bln
+1.126 bln
160.76%
Ranking of countries by current statistics by years


Comments: