29
/
en
AIzaSyAYiBZKx7MnpbEhh9jyipgxe19OcubqV5w
April 1, 2024
221129
Paraguay
PRY
true
2
1
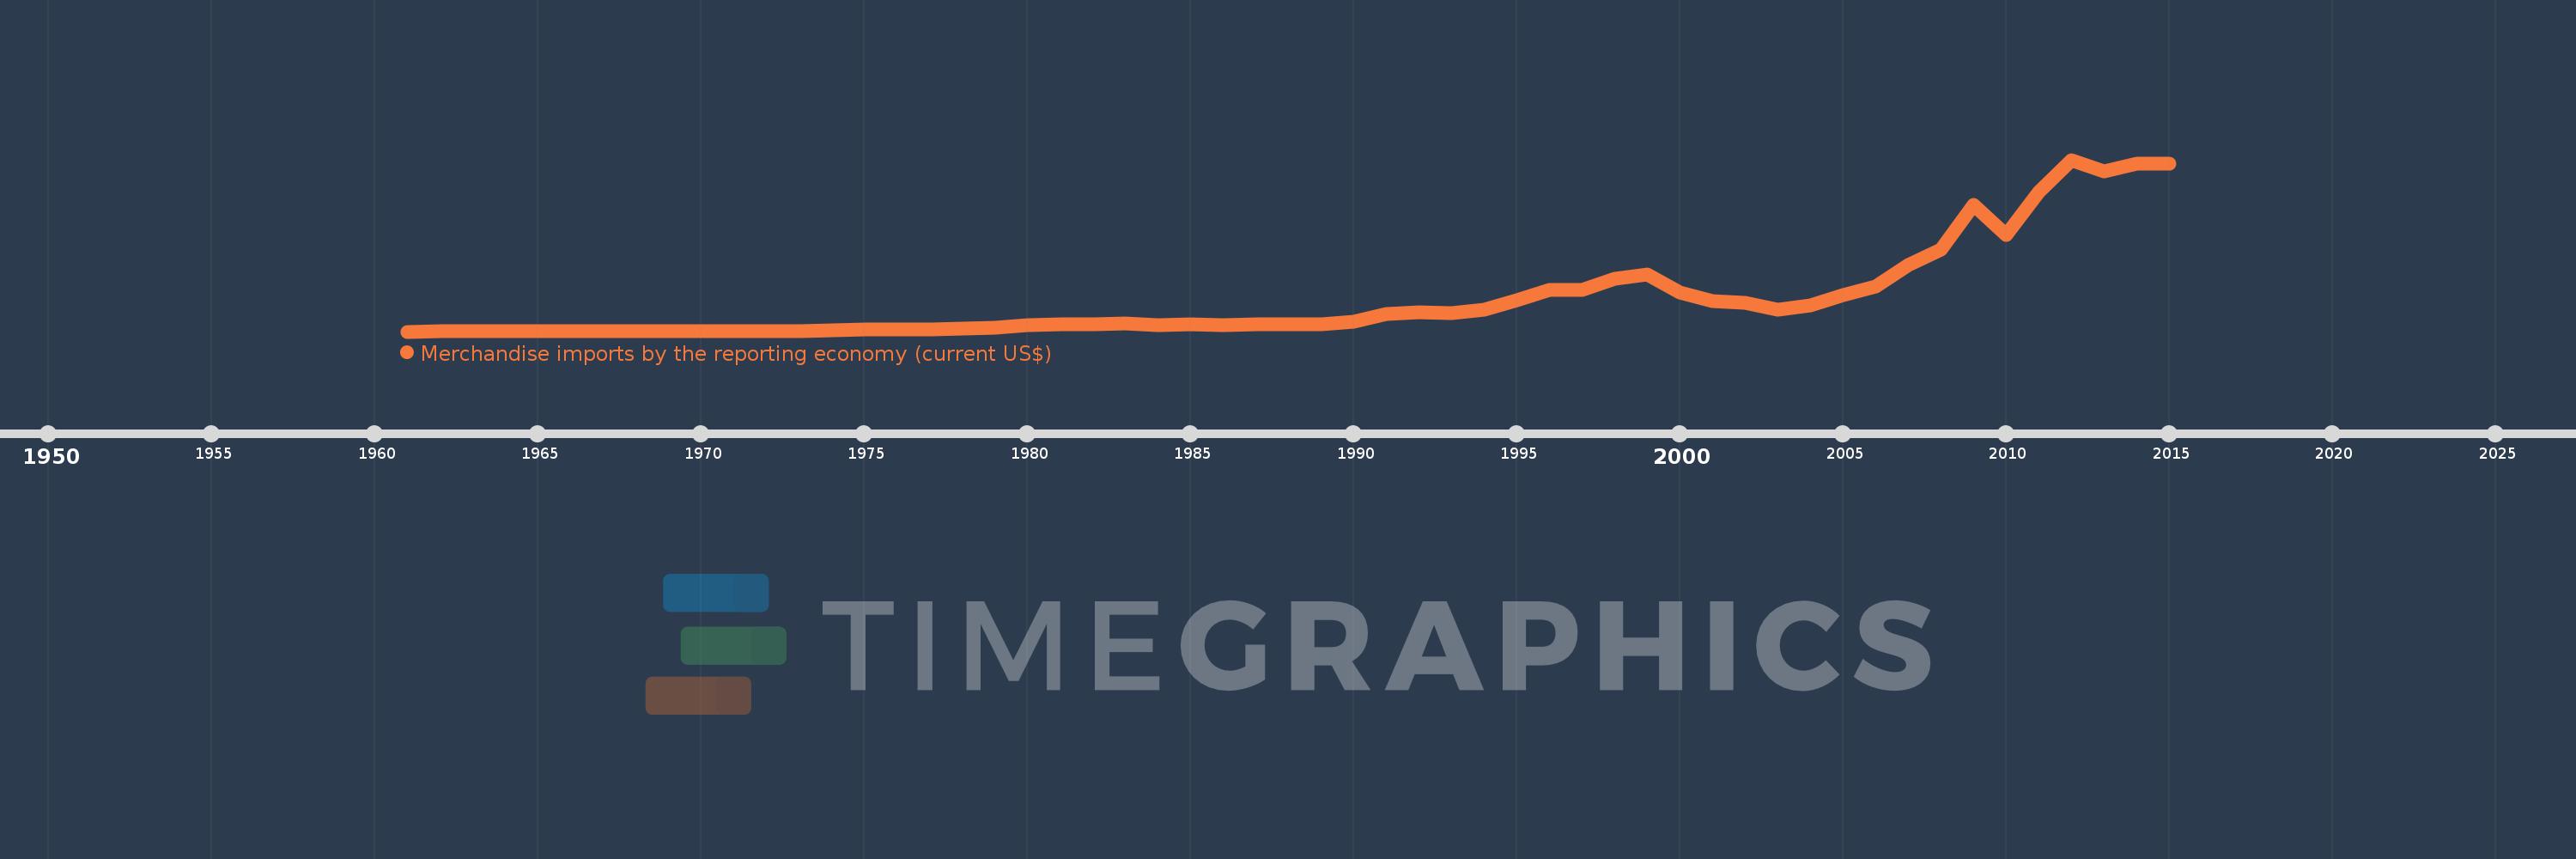
Merchandise imports by the reporting economy (current US$)
2015,2014,2013,2012,2011,2010,2009,2008,2007,2006,2005,2004,2003,2002,2001,2000,1999,1998,1997,1996,1995,1994,1993,1992,1991,1990,1989,1988,1987,1986,1985,1984,1983,1982,1981,1980,1979,1978,1977,1976,1975,1974,1973,1972,1971,1970,1969,1968,1967,1966,1965,1964,1963,1962,1961
This statistics in other country:
AfghanistanAlbaniaAlgeriaAmerican SamoaAngolaAntigua and BarbudaArab WorldArgentinaArmeniaArubaAustraliaAustriaAzerbaijanBahamas, TheBahrainBangladeshBarbadosBelarusBelgiumBelizeBeninBermudaBoliviaBosnia and HerzegovinaBrazilBrunei DarussalamBulgariaBurkina FasoBurundiCabo VerdeCambodiaCameroonCanadaCaribbean small statesCentral African RepublicCentral Europe and the BalticsChadChileChinaColombiaComorosCongo, Dem. Rep.Congo, Rep.Costa RicaCote d'IvoireCroatiaCubaCyprusCzech RepublicDenmarkDjiboutiDominicaDominican RepublicEarly-demographic dividendEast Asia & PacificEast Asia & Pacific (excluding high income)East Asia & Pacific (IDA & IBRD countries)EcuadorEgypt, Arab Rep.El SalvadorEquatorial GuineaEstoniaEthiopiaEuro areaEurope & Central AsiaEurope & Central Asia (excluding high income)Europe & Central Asia (IDA & IBRD countries)European UnionFaroe IslandsFijiFinlandFragile and conflict affected situationsFranceFrench PolynesiaGabonGambia, TheGeorgiaGermanyGhanaGibraltarGreeceGreenlandGrenadaGuamGuatemalaGuineaGuinea-BissauGuyanaHaitiHeavily indebted poor countries (HIPC)High incomeHondurasHong Kong SAR, ChinaHungaryIBRD onlyIcelandIDA & IBRD totalIDA blendIDA onlyIDA totalIndiaIndonesiaIran, Islamic Rep.IraqIrelandIsraelItalyJamaicaJapanJordanKazakhstanKenyaKiribatiKorea, Dem. People’s Rep.Korea, Rep.KosovoKuwaitKyrgyz RepublicLao PDRLate-demographic dividendLatin America & Caribbean Latin America & Caribbean (excluding high income)Latin America & the Caribbean (IDA & IBRD countries)LatviaLeast developed countries: UN classificationLebanonLiberiaLibyaLithuaniaLow & middle incomeLow incomeLower middle incomeLuxembourgMacao SAR, ChinaMacedonia, FYRMadagascarMalawiMalaysiaMaldivesMaliMaltaMauritaniaMauritiusMexicoMiddle East & North AfricaMiddle East & North Africa (excluding high income)Middle East & North Africa (IDA & IBRD countries)Middle incomeMoldovaMongoliaMontenegroMoroccoMozambiqueMyanmarNauruNepalNetherlandsNew CaledoniaNew ZealandNicaraguaNigerNigeriaNorth AmericaNorwayOECD membersOmanOther small statesPacific island small statesPakistanPanamaPapua New GuineaParaguayPeruPhilippinesPolandPortugalPost-demographic dividendPre-demographic dividendQatarRomaniaRussian FederationRwandaSamoaSao Tome and PrincipeSaudi ArabiaSenegalSerbiaSeychellesSierra LeoneSingaporeSlovak RepublicSloveniaSmall statesSolomon IslandsSomaliaSouth AfricaSouth AsiaSouth Asia (IDA & IBRD)SpainSri LankaSt. Kitts and NevisSt. LuciaSt. Vincent and the GrenadinesSub-Saharan Africa Sub-Saharan Africa (excluding high income)Sub-Saharan Africa (IDA & IBRD countries)SudanSurinameSwedenSwitzerlandSyrian Arab RepublicTajikistanTanzaniaThailandTogoTongaTrinidad and TobagoTunisiaTurkeyTurkmenistanTuvaluUgandaUkraineUnited Arab EmiratesUnited KingdomUnited StatesUpper middle incomeUruguayUzbekistanVanuatuVenezuela, RBVietnamWorldYemen, Rep.ZambiaZimbabwe Timeline:
This timeline shows a graph from 1961 to 2015 of Paraguay. No data until 1960. Number of actual observations by date: 55.
Source name:
World Development Indicators
Source organization:
World Bank staff estimates based data from International Monetary Fund's Direction of Trade database.
Categories, topics:
Private Sector, Trade
Last updated:
apr 23, 2017
Indicators value changes by year
Minimum:
35.622 mln
jan 1, 1961
Maximum:
12.704 bln
jan 1, 2012
At the date of observation
Value
Absolute change
Change from previous value
jan 1, 1961
35.622 mln
+35.622 mln
0.0%
jan 1, 1962
38.208 mln
+2.586 mln
7.26%
jan 1, 1963
38.17 mln
-38.0K
-0.1%
jan 1, 1964
35.863 mln
-2.307 mln
-6.04%
jan 1, 1965
37.145 mln
+1.282 mln
3.57%
jan 1, 1966
52.095 mln
+14.95 mln
40.25%
jan 1, 1967
57.645 mln
+5.55 mln
10.65%
jan 1, 1968
69.199 mln
+11.554 mln
20.04%
jan 1, 1969
69.926 mln
+727.0K
1.05%
jan 1, 1970
80.559 mln
+10.633 mln
15.21%
jan 1, 1971
69.925 mln
-10.634 mln
-13.2%
jan 1, 1972
77.03 mln
+7.105 mln
10.16%
jan 1, 1973
76.593 mln
-437.0K
-0.57%
jan 1, 1974
114.992 mln
+38.399 mln
50.13%
jan 1, 1975
188.118 mln
+73.126 mln
63.59%
jan 1, 1976
195.564 mln
+7.446 mln
3.96%
jan 1, 1977
197.882 mln
+2.318 mln
1.19%
jan 1, 1978
279.995 mln
+82.113 mln
41.5%
jan 1, 1979
346.717 mln
+66.722 mln
23.83%
jan 1, 1980
479.162 mln
+132.445 mln
38.2%
jan 1, 1981
571.476 mln
+92.314 mln
19.27%
jan 1, 1982
557.237 mln
-14.239 mln
-2.49%
jan 1, 1983
637.483 mln
+80.246 mln
14.4%
jan 1, 1984
525.019 mln
-112.464 mln
-17.64%
jan 1, 1985
563.937 mln
+38.918 mln
7.41%
jan 1, 1986
492.605 mln
-71.332 mln
-12.65%
jan 1, 1987
566.16 mln
+73.555 mln
14.93%
jan 1, 1988
576.336 mln
+10.175 mln
1.8%
jan 1, 1989
548.459 mln
-27.877 mln
-4.84%
jan 1, 1990
739.722 mln
+191.263 mln
34.87%
jan 1, 1991
1.341 bln
+601.3 mln
81.29%
jan 1, 1992
1.445 bln
+103.708 mln
7.73%
jan 1, 1993
1.4 bln
-45.021 mln
-3.12%
jan 1, 1994
1.672 bln
+272.536 mln
19.47%
jan 1, 1995
2.354 bln
+682.235 mln
40.8%
jan 1, 1996
3.077 bln
+722.136 mln
30.67%
jan 1, 1997
3.136 bln
+58.907 mln
1.91%
jan 1, 1998
3.952 bln
+816.053 mln
26.03%
jan 1, 1999
4.244 bln
+292.43 mln
7.4%
jan 1, 2000
2.887 bln
-1.357 bln
-31.98%
jan 1, 2001
2.255 bln
-631.213 mln
-21.87%
jan 1, 2002
2.187 bln
-68.125 mln
-3.02%
jan 1, 2003
1.661 bln
-526.257 mln
-24.06%
jan 1, 2004
1.948 bln
+287.386 mln
17.3%
jan 1, 2005
2.712 bln
+763.326 mln
39.18%
jan 1, 2006
3.364 bln
+651.828 mln
24.04%
jan 1, 2007
4.969 bln
+1.606 bln
47.73%
jan 1, 2008
6.107 bln
+1.138 bln
22.89%
jan 1, 2009
9.372 bln
+3.265 bln
53.47%
jan 1, 2010
7.167 bln
-2.205 bln
-23.53%
jan 1, 2011
10.332 bln
+3.165 bln
44.17%
jan 1, 2012
12.704 bln
+2.371 bln
22.95%
jan 1, 2013
11.832 bln
-871.853 mln
-6.86%
jan 1, 2014
12.432 bln
+599.882 mln
5.07%
jan 1, 2015
12.429 bln
-2.982 mln
-0.02%
Ranking of countries by current statistics by years


Comments: