29
/
en
AIzaSyAYiBZKx7MnpbEhh9jyipgxe19OcubqV5w
April 1, 2024
189246
Maldives
MDV
true
2
1
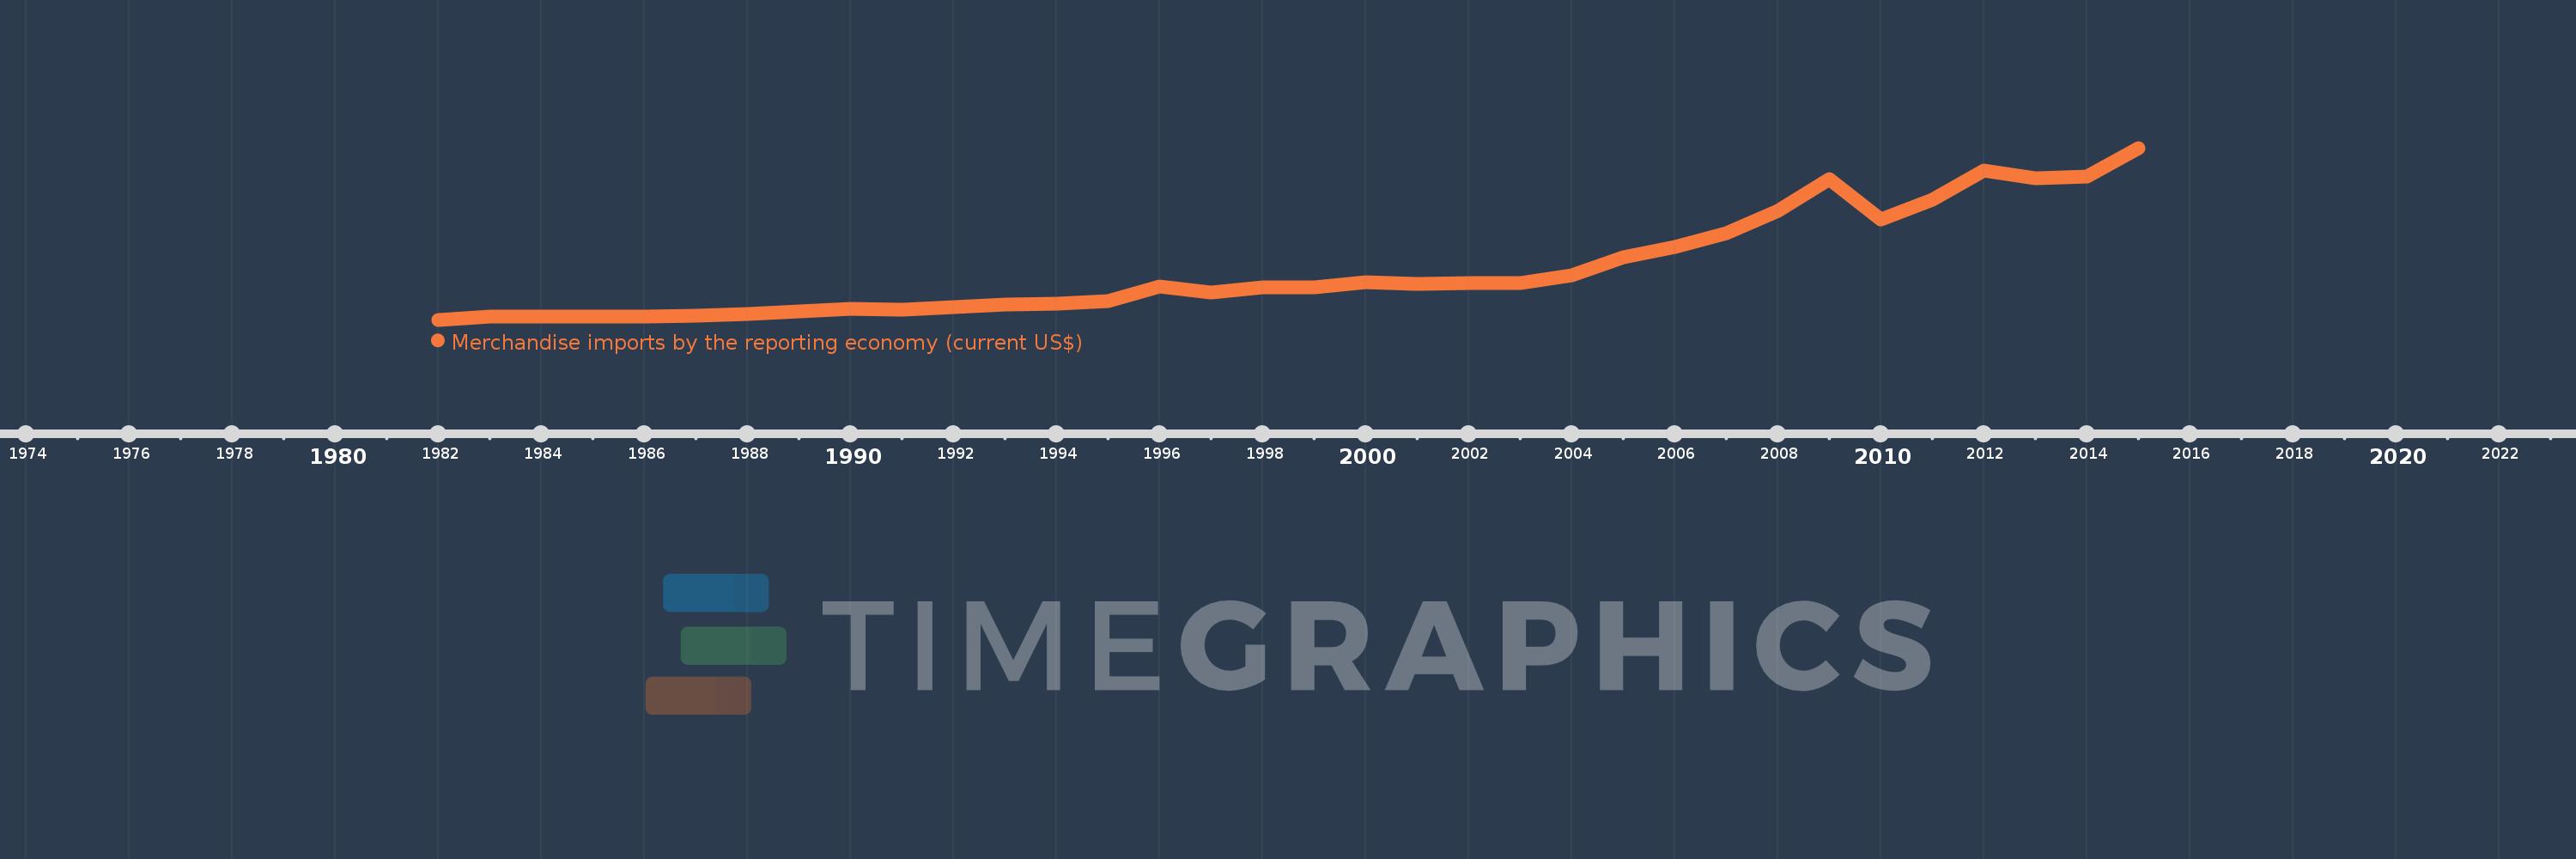
Merchandise imports by the reporting economy (current US$)
2015,2014,2013,2012,2011,2010,2009,2008,2007,2006,2005,2004,2003,2002,2001,2000,1999,1998,1997,1996,1995,1994,1993,1992,1991,1990,1989,1988,1987,1986,1985,1984,1983,1982
This statistics in other country:
AfghanistanAlbaniaAlgeriaAmerican SamoaAngolaAntigua and BarbudaArab WorldArgentinaArmeniaArubaAustraliaAustriaAzerbaijanBahamas, TheBahrainBangladeshBarbadosBelarusBelgiumBelizeBeninBermudaBoliviaBosnia and HerzegovinaBrazilBrunei DarussalamBulgariaBurkina FasoBurundiCabo VerdeCambodiaCameroonCanadaCaribbean small statesCentral African RepublicCentral Europe and the BalticsChadChileChinaColombiaComorosCongo, Dem. Rep.Congo, Rep.Costa RicaCote d'IvoireCroatiaCubaCyprusCzech RepublicDenmarkDjiboutiDominicaDominican RepublicEarly-demographic dividendEast Asia & PacificEast Asia & Pacific (excluding high income)East Asia & Pacific (IDA & IBRD countries)EcuadorEgypt, Arab Rep.El SalvadorEquatorial GuineaEstoniaEthiopiaEuro areaEurope & Central AsiaEurope & Central Asia (excluding high income)Europe & Central Asia (IDA & IBRD countries)European UnionFaroe IslandsFijiFinlandFragile and conflict affected situationsFranceFrench PolynesiaGabonGambia, TheGeorgiaGermanyGhanaGibraltarGreeceGreenlandGrenadaGuamGuatemalaGuineaGuinea-BissauGuyanaHaitiHeavily indebted poor countries (HIPC)High incomeHondurasHong Kong SAR, ChinaHungaryIBRD onlyIcelandIDA & IBRD totalIDA blendIDA onlyIDA totalIndiaIndonesiaIran, Islamic Rep.IraqIrelandIsraelItalyJamaicaJapanJordanKazakhstanKenyaKiribatiKorea, Dem. People’s Rep.Korea, Rep.KosovoKuwaitKyrgyz RepublicLao PDRLate-demographic dividendLatin America & Caribbean Latin America & Caribbean (excluding high income)Latin America & the Caribbean (IDA & IBRD countries)LatviaLeast developed countries: UN classificationLebanonLiberiaLibyaLithuaniaLow & middle incomeLow incomeLower middle incomeLuxembourgMacao SAR, ChinaMacedonia, FYRMadagascarMalawiMalaysiaMaldivesMaliMaltaMauritaniaMauritiusMexicoMiddle East & North AfricaMiddle East & North Africa (excluding high income)Middle East & North Africa (IDA & IBRD countries)Middle incomeMoldovaMongoliaMontenegroMoroccoMozambiqueMyanmarNauruNepalNetherlandsNew CaledoniaNew ZealandNicaraguaNigerNigeriaNorth AmericaNorwayOECD membersOmanOther small statesPacific island small statesPakistanPanamaPapua New GuineaParaguayPeruPhilippinesPolandPortugalPost-demographic dividendPre-demographic dividendQatarRomaniaRussian FederationRwandaSamoaSao Tome and PrincipeSaudi ArabiaSenegalSerbiaSeychellesSierra LeoneSingaporeSlovak RepublicSloveniaSmall statesSolomon IslandsSomaliaSouth AfricaSouth AsiaSouth Asia (IDA & IBRD)SpainSri LankaSt. Kitts and NevisSt. LuciaSt. Vincent and the GrenadinesSub-Saharan Africa Sub-Saharan Africa (excluding high income)Sub-Saharan Africa (IDA & IBRD countries)SudanSurinameSwedenSwitzerlandSyrian Arab RepublicTajikistanTanzaniaThailandTogoTongaTrinidad and TobagoTunisiaTurkeyTurkmenistanTuvaluUgandaUkraineUnited Arab EmiratesUnited KingdomUnited StatesUpper middle incomeUruguayUzbekistanVanuatuVenezuela, RBVietnamWorldYemen, Rep.ZambiaZimbabwe Timeline:
This timeline shows a graph from 1982 to 2015 of Maldives. No data until 1981. Number of actual observations by date: 34.
Source name:
World Development Indicators
Source organization:
World Bank staff estimates based data from International Monetary Fund's Direction of Trade database.
Categories, topics:
Private Sector, Trade
Last updated:
apr 23, 2017
Indicators value changes by year
Minimum:
38.534 mln
jan 1, 1982
Maximum:
1.704 bln
jan 1, 2015
At the date of observation
Value
Absolute change
Change from previous value
jan 1, 1982
38.534 mln
+38.534 mln
0.0%
jan 1, 1983
68.59 mln
+30.056 mln
78.0%
jan 1, 1984
66.226 mln
-2.365 mln
-3.45%
jan 1, 1985
70.836 mln
+4.61 mln
6.96%
jan 1, 1986
70.125 mln
-711.13K
-1.0%
jan 1, 1987
78.425 mln
+8.3 mln
11.84%
jan 1, 1988
98.122 mln
+19.697 mln
25.12%
jan 1, 1989
121.997 mln
+23.875 mln
24.33%
jan 1, 1990
143.013 mln
+21.016 mln
17.23%
jan 1, 1991
137.879 mln
-5.134 mln
-3.59%
jan 1, 1992
161.751 mln
+23.872 mln
17.31%
jan 1, 1993
189.28 mln
+27.529 mln
17.02%
jan 1, 1994
191.277 mln
+1.997 mln
1.06%
jan 1, 1995
221.717 mln
+30.44 mln
15.91%
jan 1, 1996
356.66 mln
+134.943 mln
60.86%
jan 1, 1997
300.136 mln
-56.524 mln
-15.85%
jan 1, 1998
348.848 mln
+48.713 mln
16.23%
jan 1, 1999
353.972 mln
+5.123 mln
1.47%
jan 1, 2000
402.16 mln
+48.188 mln
13.61%
jan 1, 2001
388.987 mln
-13.172 mln
-3.28%
jan 1, 2002
392.97 mln
+3.982 mln
1.02%
jan 1, 2003
390.724 mln
-2.246 mln
-0.57%
jan 1, 2004
470.654 mln
+79.931 mln
20.46%
jan 1, 2005
644.979 mln
+174.325 mln
37.04%
jan 1, 2006
744.903 mln
+99.924 mln
15.49%
jan 1, 2007
880.515 mln
+135.612 mln
18.21%
jan 1, 2008
1.095 bln
+214.149 mln
24.32%
jan 1, 2009
1.4 bln
+305.258 mln
27.89%
jan 1, 2010
1.014 bln
-386.197 mln
-27.59%
jan 1, 2011
1.205 bln
+191.265 mln
18.87%
jan 1, 2012
1.486 bln
+281.265 mln
23.34%
jan 1, 2013
1.414 bln
-72.359 mln
-4.87%
jan 1, 2014
1.428 bln
+14.238 mln
1.01%
jan 1, 2015
1.704 bln
+275.88 mln
19.32%
Ranking of countries by current statistics by years


Comments: