29
/
en
AIzaSyAYiBZKx7MnpbEhh9jyipgxe19OcubqV5w
April 1, 2024
48316
Middle East & North Africa
MEA
false
2
1
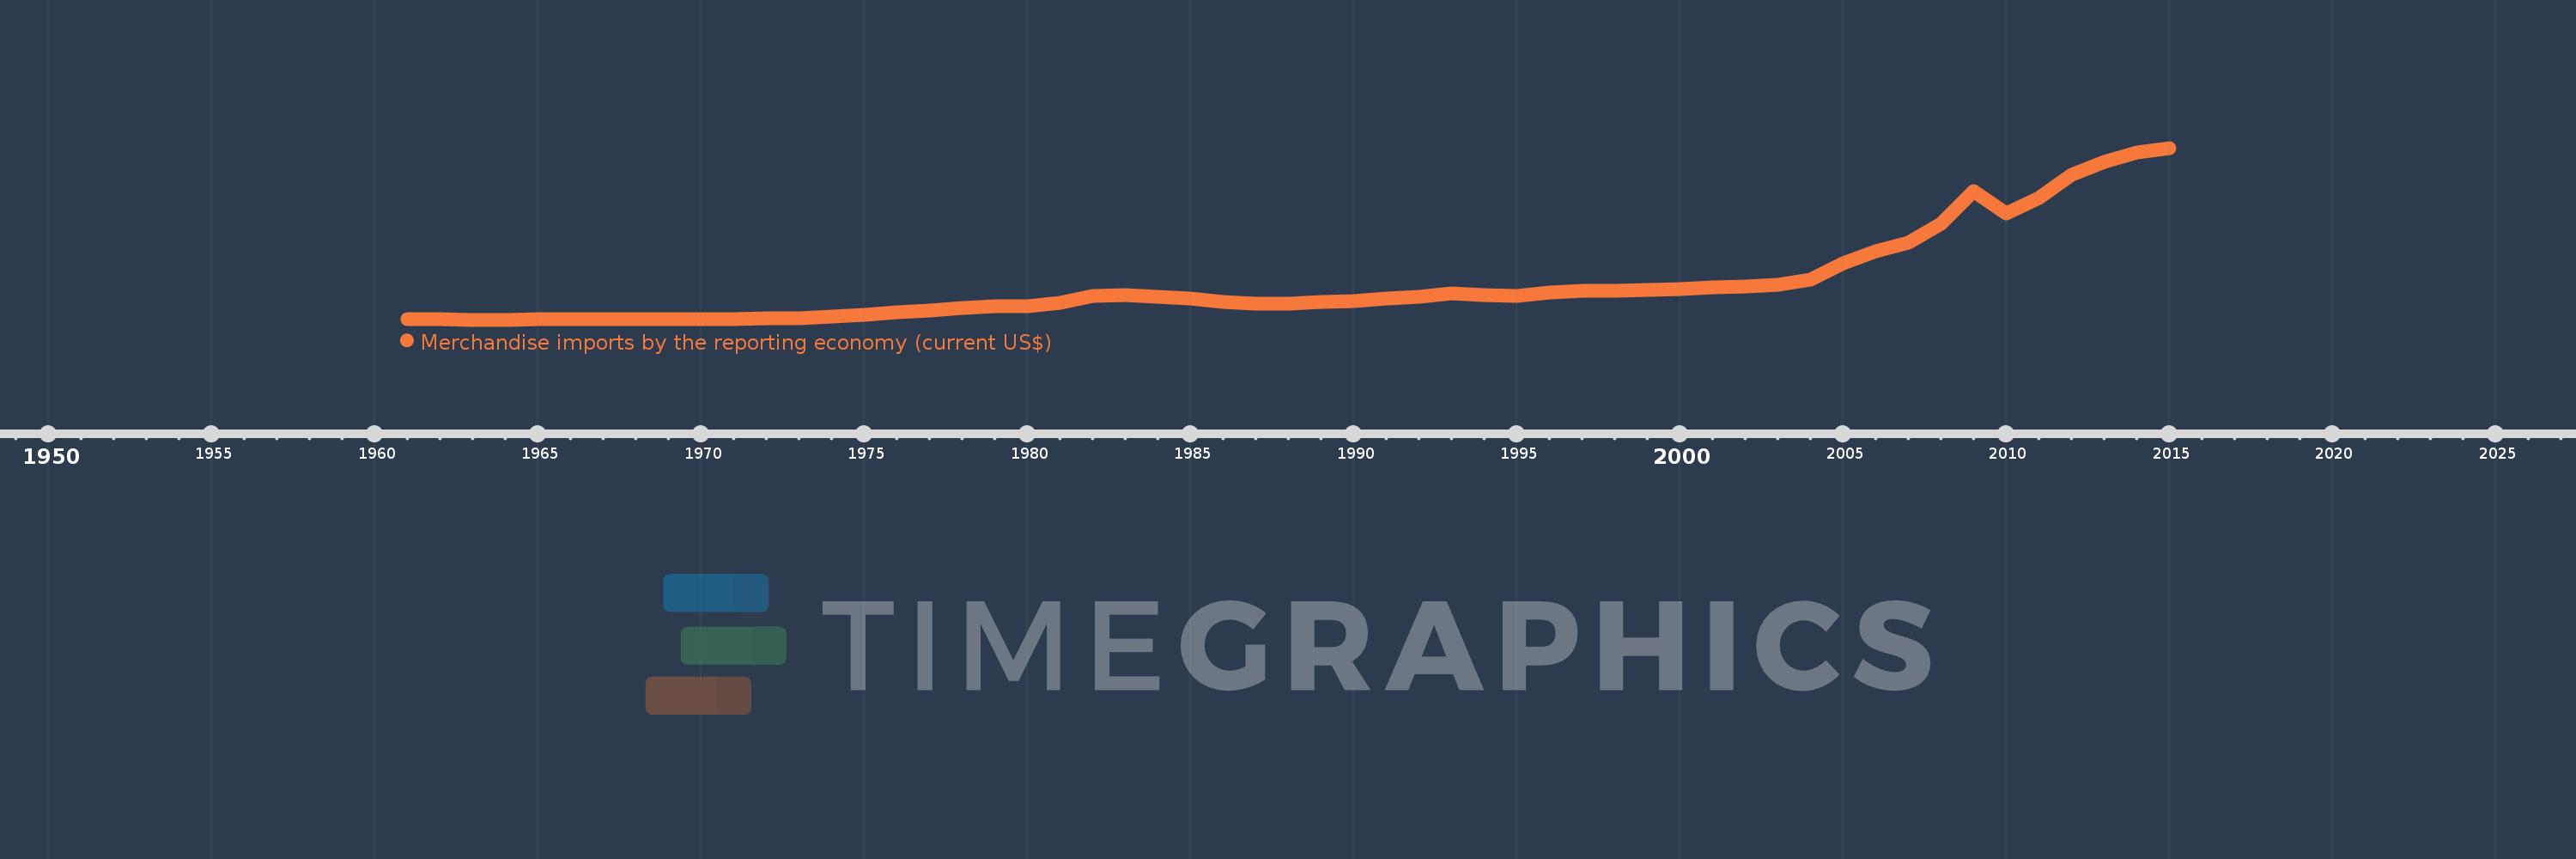
Merchandise imports by the reporting economy (current US$)
2015,2014,2013,2012,2011,2010,2009,2008,2007,2006,2005,2004,2003,2002,2001,2000,1999,1998,1997,1996,1995,1994,1993,1992,1991,1990,1989,1988,1987,1986,1985,1984,1983,1982,1981,1980,1979,1978,1977,1976,1975,1974,1973,1972,1971,1970,1969,1968,1967,1966,1965,1964,1963,1962,1961
This statistics in other country:
AfghanistanAlbaniaAlgeriaAmerican SamoaAngolaAntigua and BarbudaArab WorldArgentinaArmeniaArubaAustraliaAustriaAzerbaijanBahamas, TheBahrainBangladeshBarbadosBelarusBelgiumBelizeBeninBermudaBoliviaBosnia and HerzegovinaBrazilBrunei DarussalamBulgariaBurkina FasoBurundiCabo VerdeCambodiaCameroonCanadaCaribbean small statesCentral African RepublicCentral Europe and the BalticsChadChileChinaColombiaComorosCongo, Dem. Rep.Congo, Rep.Costa RicaCote d'IvoireCroatiaCubaCyprusCzech RepublicDenmarkDjiboutiDominicaDominican RepublicEarly-demographic dividendEast Asia & PacificEast Asia & Pacific (excluding high income)East Asia & Pacific (IDA & IBRD countries)EcuadorEgypt, Arab Rep.El SalvadorEquatorial GuineaEstoniaEthiopiaEuro areaEurope & Central AsiaEurope & Central Asia (excluding high income)Europe & Central Asia (IDA & IBRD countries)European UnionFaroe IslandsFijiFinlandFragile and conflict affected situationsFranceFrench PolynesiaGabonGambia, TheGeorgiaGermanyGhanaGibraltarGreeceGreenlandGrenadaGuamGuatemalaGuineaGuinea-BissauGuyanaHaitiHeavily indebted poor countries (HIPC)High incomeHondurasHong Kong SAR, ChinaHungaryIBRD onlyIcelandIDA & IBRD totalIDA blendIDA onlyIDA totalIndiaIndonesiaIran, Islamic Rep.IraqIrelandIsraelItalyJamaicaJapanJordanKazakhstanKenyaKiribatiKorea, Dem. People’s Rep.Korea, Rep.KosovoKuwaitKyrgyz RepublicLao PDRLate-demographic dividendLatin America & Caribbean Latin America & Caribbean (excluding high income)Latin America & the Caribbean (IDA & IBRD countries)LatviaLeast developed countries: UN classificationLebanonLiberiaLibyaLithuaniaLow & middle incomeLow incomeLower middle incomeLuxembourgMacao SAR, ChinaMacedonia, FYRMadagascarMalawiMalaysiaMaldivesMaliMaltaMauritaniaMauritiusMexicoMiddle East & North AfricaMiddle East & North Africa (excluding high income)Middle East & North Africa (IDA & IBRD countries)Middle incomeMoldovaMongoliaMontenegroMoroccoMozambiqueMyanmarNauruNepalNetherlandsNew CaledoniaNew ZealandNicaraguaNigerNigeriaNorth AmericaNorwayOECD membersOmanOther small statesPacific island small statesPakistanPanamaPapua New GuineaParaguayPeruPhilippinesPolandPortugalPost-demographic dividendPre-demographic dividendQatarRomaniaRussian FederationRwandaSamoaSao Tome and PrincipeSaudi ArabiaSenegalSerbiaSeychellesSierra LeoneSingaporeSlovak RepublicSloveniaSmall statesSolomon IslandsSomaliaSouth AfricaSouth AsiaSouth Asia (IDA & IBRD)SpainSri LankaSt. Kitts and NevisSt. LuciaSt. Vincent and the GrenadinesSub-Saharan Africa Sub-Saharan Africa (excluding high income)Sub-Saharan Africa (IDA & IBRD countries)SudanSurinameSwedenSwitzerlandSyrian Arab RepublicTajikistanTanzaniaThailandTogoTongaTrinidad and TobagoTunisiaTurkeyTurkmenistanTuvaluUgandaUkraineUnited Arab EmiratesUnited KingdomUnited StatesUpper middle incomeUruguayUzbekistanVanuatuVenezuela, RBVietnamWorldYemen, Rep.ZambiaZimbabwe Timeline:
This timeline shows a graph from 1961 to 2015 of Middle East & North Africa. No data until 1960. Number of actual observations by date: 55.
Source name:
World Development Indicators
Source organization:
World Bank staff estimates based data from International Monetary Fund's Direction of Trade database.
Categories, topics:
Private Sector, Trade
Last updated:
apr 23, 2017
Indicators value changes by year
Minimum:
3.556 bln
jan 1, 1963
Maximum:
1.082 trl
jan 1, 2015
At the date of observation
Value
Absolute change
Change from previous value
jan 1, 1961
4.876 bln
+4.876 bln
0.0%
jan 1, 1962
4.811 bln
-65.0 mln
-1.33%
jan 1, 1963
3.556 bln
-1.256 bln
-26.1%
jan 1, 1964
4.483 bln
+927.64 mln
26.09%
jan 1, 1965
6.089 bln
+1.606 bln
35.82%
jan 1, 1966
5.404 bln
-684.85 mln
-11.25%
jan 1, 1967
7.143 bln
+1.739 bln
32.18%
jan 1, 1968
7.055 bln
-87.53 mln
-1.23%
jan 1, 1969
8.044 bln
+988.77 mln
14.01%
jan 1, 1970
9.295 bln
+1.251 bln
15.55%
jan 1, 1971
9.083 bln
-212.44 mln
-2.29%
jan 1, 1972
10.267 bln
+1.184 bln
13.04%
jan 1, 1973
12.288 bln
+2.021 bln
19.69%
jan 1, 1974
22.524 bln
+10.236 bln
83.3%
jan 1, 1975
35.694 bln
+13.17 bln
58.47%
jan 1, 1976
52.439 bln
+16.746 bln
46.91%
jan 1, 1977
61.364 bln
+8.925 bln
17.02%
jan 1, 1978
78.946 bln
+17.582 bln
28.65%
jan 1, 1979
86.037 bln
+7.091 bln
8.98%
jan 1, 1980
89.929 bln
+3.892 bln
4.52%
jan 1, 1981
109.841 bln
+19.911 bln
22.14%
jan 1, 1982
153.39 bln
+43.549 bln
39.65%
jan 1, 1983
156.348 bln
+2.958 bln
1.93%
jan 1, 1984
147.109 bln
-9.239 bln
-5.91%
jan 1, 1985
135.393 bln
-11.716 bln
-7.96%
jan 1, 1986
113.252 bln
-22.141 bln
-16.35%
jan 1, 1987
103.489 bln
-9.763 bln
-8.62%
jan 1, 1988
103.84 bln
+351.038 mln
0.34%
jan 1, 1989
114.663 bln
+10.823 bln
10.42%
jan 1, 1990
120.151 bln
+5.488 bln
4.79%
jan 1, 1991
139.027 bln
+18.876 bln
15.71%
jan 1, 1992
149.808 bln
+10.781 bln
7.75%
jan 1, 1993
170.562 bln
+20.754 bln
13.85%
jan 1, 1994
159.585 bln
-10.976 bln
-6.44%
jan 1, 1995
153.864 bln
-5.721 bln
-3.58%
jan 1, 1996
172.671 bln
+18.807 bln
12.22%
jan 1, 1997
183.543 bln
+10.872 bln
6.3%
jan 1, 1998
183.435 bln
-108.524 mln
-0.06%
jan 1, 1999
189.071 bln
+5.636 bln
3.07%
jan 1, 2000
198.584 bln
+9.513 bln
5.03%
jan 1, 2001
207.697 bln
+9.114 bln
4.59%
jan 1, 2002
211.649 bln
+3.952 bln
1.9%
jan 1, 2003
221.149 bln
+9.5 bln
4.49%
jan 1, 2004
255.413 bln
+34.264 bln
15.49%
jan 1, 2005
360.11 bln
+104.697 bln
40.99%
jan 1, 2006
430.936 bln
+70.826 bln
19.67%
jan 1, 2007
487.731 bln
+56.795 bln
13.18%
jan 1, 2008
608.037 bln
+120.306 bln
24.67%
jan 1, 2009
810.832 bln
+202.795 bln
33.35%
jan 1, 2010
671.285 bln
-139.547 bln
-17.21%
jan 1, 2011
768.848 bln
+97.562 bln
14.53%
jan 1, 2012
910.802 bln
+141.954 bln
18.46%
jan 1, 2013
993.514 bln
+82.712 bln
9.08%
jan 1, 2014
1.051 trl
+57.299 bln
5.77%
jan 1, 2015
1.082 trl
+30.795 bln
2.93%
Ranking of countries by current statistics by years


Comments: