29
/
en
AIzaSyAYiBZKx7MnpbEhh9jyipgxe19OcubqV5w
April 1, 2024
186788
Malawi
MWI
true
2
1
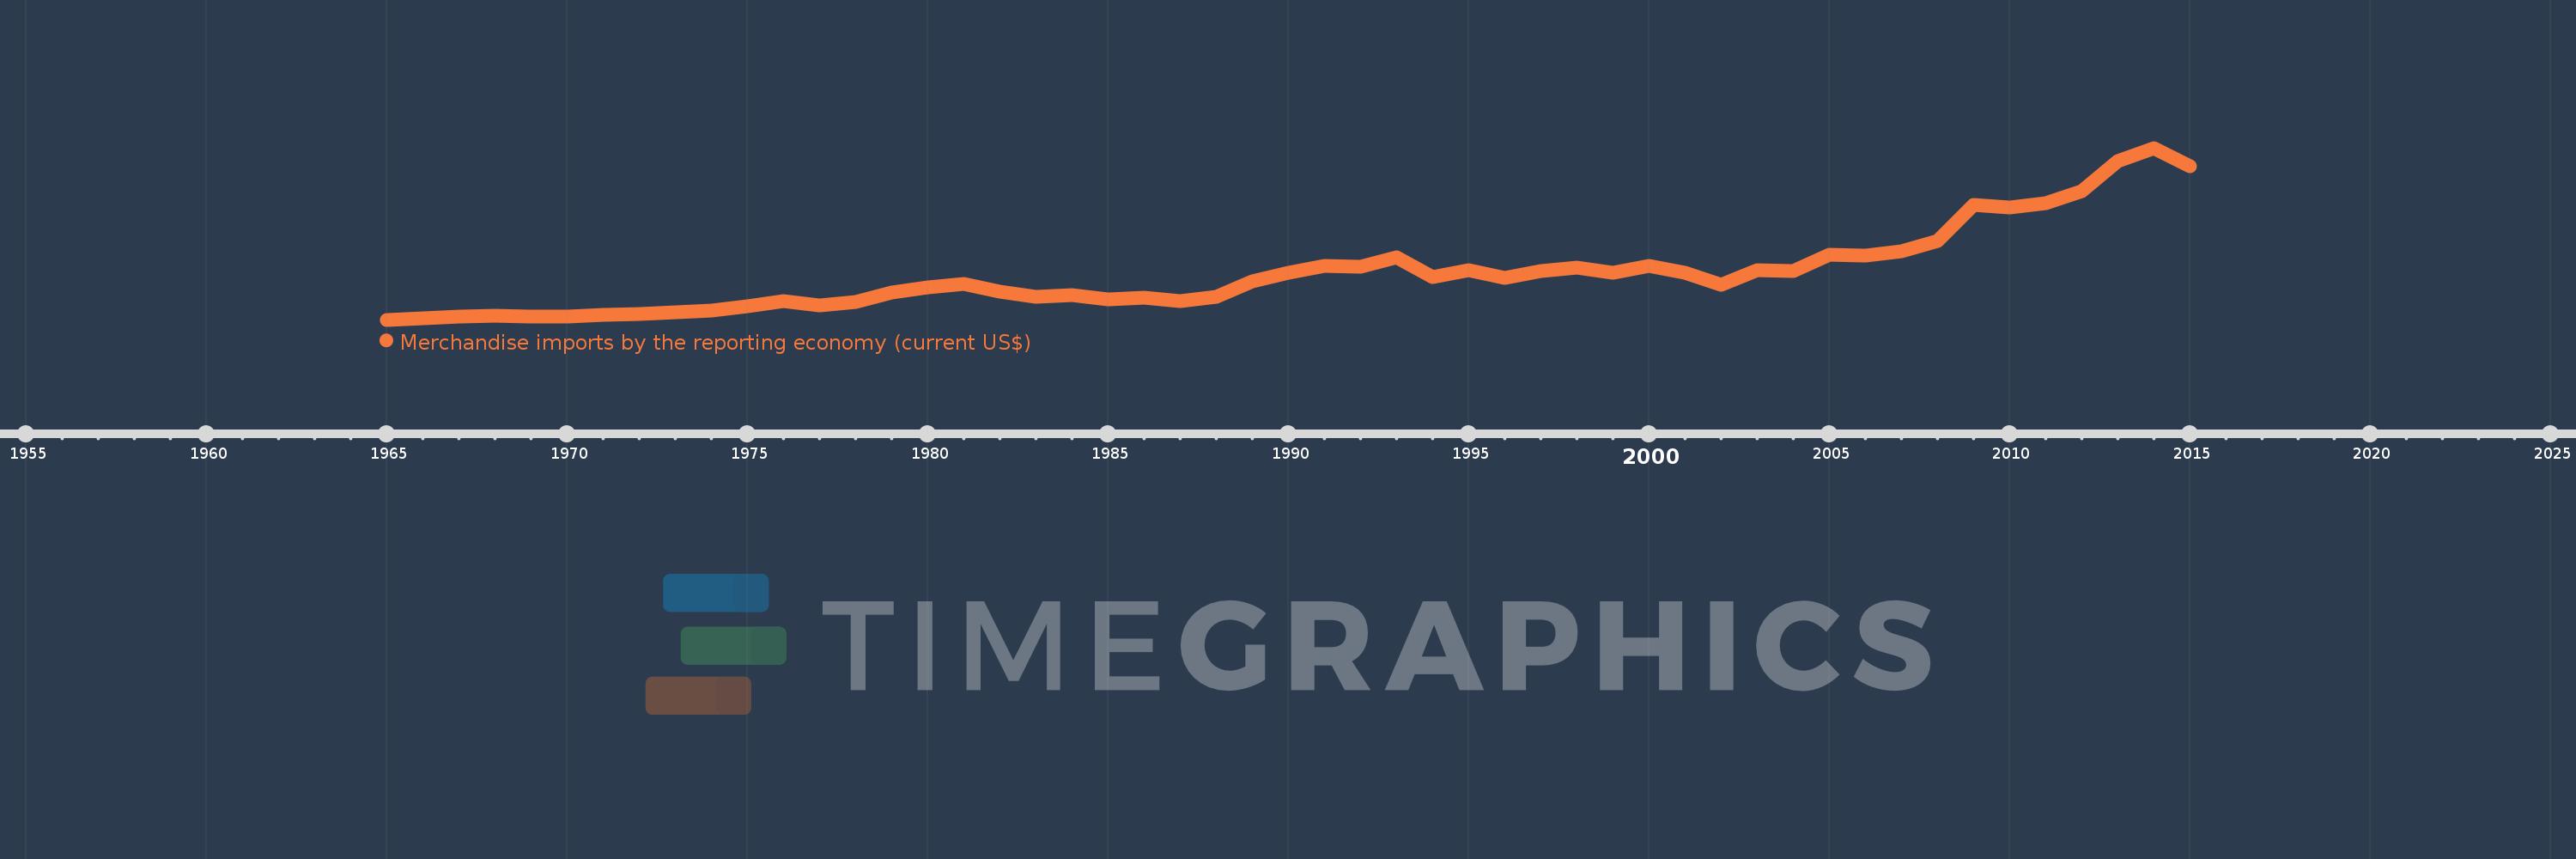
Merchandise imports by the reporting economy (current US$)
2015,2014,2013,2012,2011,2010,2009,2008,2007,2006,2005,2004,2003,2002,2001,2000,1999,1998,1997,1996,1995,1994,1993,1992,1991,1990,1989,1988,1987,1986,1985,1984,1983,1982,1981,1980,1979,1978,1977,1976,1975,1974,1973,1972,1971,1970,1969,1968,1967,1966,1965
This statistics in other country:
AfghanistanAlbaniaAlgeriaAmerican SamoaAngolaAntigua and BarbudaArab WorldArgentinaArmeniaArubaAustraliaAustriaAzerbaijanBahamas, TheBahrainBangladeshBarbadosBelarusBelgiumBelizeBeninBermudaBoliviaBosnia and HerzegovinaBrazilBrunei DarussalamBulgariaBurkina FasoBurundiCabo VerdeCambodiaCameroonCanadaCaribbean small statesCentral African RepublicCentral Europe and the BalticsChadChileChinaColombiaComorosCongo, Dem. Rep.Congo, Rep.Costa RicaCote d'IvoireCroatiaCubaCyprusCzech RepublicDenmarkDjiboutiDominicaDominican RepublicEarly-demographic dividendEast Asia & PacificEast Asia & Pacific (excluding high income)East Asia & Pacific (IDA & IBRD countries)EcuadorEgypt, Arab Rep.El SalvadorEquatorial GuineaEstoniaEthiopiaEuro areaEurope & Central AsiaEurope & Central Asia (excluding high income)Europe & Central Asia (IDA & IBRD countries)European UnionFaroe IslandsFijiFinlandFragile and conflict affected situationsFranceFrench PolynesiaGabonGambia, TheGeorgiaGermanyGhanaGibraltarGreeceGreenlandGrenadaGuamGuatemalaGuineaGuinea-BissauGuyanaHaitiHeavily indebted poor countries (HIPC)High incomeHondurasHong Kong SAR, ChinaHungaryIBRD onlyIcelandIDA & IBRD totalIDA blendIDA onlyIDA totalIndiaIndonesiaIran, Islamic Rep.IraqIrelandIsraelItalyJamaicaJapanJordanKazakhstanKenyaKiribatiKorea, Dem. People’s Rep.Korea, Rep.KosovoKuwaitKyrgyz RepublicLao PDRLate-demographic dividendLatin America & Caribbean Latin America & Caribbean (excluding high income)Latin America & the Caribbean (IDA & IBRD countries)LatviaLeast developed countries: UN classificationLebanonLiberiaLibyaLithuaniaLow & middle incomeLow incomeLower middle incomeLuxembourgMacao SAR, ChinaMacedonia, FYRMadagascarMalawiMalaysiaMaldivesMaliMaltaMauritaniaMauritiusMexicoMiddle East & North AfricaMiddle East & North Africa (excluding high income)Middle East & North Africa (IDA & IBRD countries)Middle incomeMoldovaMongoliaMontenegroMoroccoMozambiqueMyanmarNauruNepalNetherlandsNew CaledoniaNew ZealandNicaraguaNigerNigeriaNorth AmericaNorwayOECD membersOmanOther small statesPacific island small statesPakistanPanamaPapua New GuineaParaguayPeruPhilippinesPolandPortugalPost-demographic dividendPre-demographic dividendQatarRomaniaRussian FederationRwandaSamoaSao Tome and PrincipeSaudi ArabiaSenegalSerbiaSeychellesSierra LeoneSingaporeSlovak RepublicSloveniaSmall statesSolomon IslandsSomaliaSouth AfricaSouth AsiaSouth Asia (IDA & IBRD)SpainSri LankaSt. Kitts and NevisSt. LuciaSt. Vincent and the GrenadinesSub-Saharan Africa Sub-Saharan Africa (excluding high income)Sub-Saharan Africa (IDA & IBRD countries)SudanSurinameSwedenSwitzerlandSyrian Arab RepublicTajikistanTanzaniaThailandTogoTongaTrinidad and TobagoTunisiaTurkeyTurkmenistanTuvaluUgandaUkraineUnited Arab EmiratesUnited KingdomUnited StatesUpper middle incomeUruguayUzbekistanVanuatuVenezuela, RBVietnamWorldYemen, Rep.ZambiaZimbabwe Timeline:
This timeline shows a graph from 1965 to 2015 of Malawi. No data until 1964. Number of actual observations by date: 51.
Source name:
World Development Indicators
Source organization:
World Bank staff estimates based data from International Monetary Fund's Direction of Trade database.
Categories, topics:
Private Sector, Trade
Last updated:
apr 23, 2017
Indicators value changes by year
Minimum:
45.32 mln
jan 1, 1965
Maximum:
1.912 bln
jan 1, 2014
At the date of observation
Value
Absolute change
Change from previous value
jan 1, 1965
45.32 mln
+45.32 mln
0.0%
jan 1, 1966
60.3 mln
+14.98 mln
33.05%
jan 1, 1967
84.26 mln
+23.96 mln
39.73%
jan 1, 1968
86.57 mln
+2.31 mln
2.74%
jan 1, 1969
77.33 mln
-9.24 mln
-10.67%
jan 1, 1970
81.147 mln
+3.817 mln
4.94%
jan 1, 1971
94.205 mln
+13.058 mln
16.09%
jan 1, 1972
109.042 mln
+14.837 mln
15.75%
jan 1, 1973
129.667 mln
+20.625 mln
18.91%
jan 1, 1974
143.16 mln
+13.493 mln
10.41%
jan 1, 1975
187.877 mln
+44.717 mln
31.24%
jan 1, 1976
250.012 mln
+62.135 mln
33.07%
jan 1, 1977
205.734 mln
-44.278 mln
-17.71%
jan 1, 1978
234.854 mln
+29.12 mln
14.15%
jan 1, 1979
338.768 mln
+103.914 mln
44.25%
jan 1, 1980
399.22 mln
+60.452 mln
17.84%
jan 1, 1981
438.79 mln
+39.57 mln
9.91%
jan 1, 1982
347.868 mln
-90.922 mln
-20.72%
jan 1, 1983
290.832 mln
-57.036 mln
-16.4%
jan 1, 1984
312.375 mln
+21.543 mln
7.41%
jan 1, 1985
270.566 mln
-41.809 mln
-13.38%
jan 1, 1986
281.206 mln
+10.64 mln
3.93%
jan 1, 1987
246.861 mln
-34.345 mln
-12.21%
jan 1, 1988
298.0 mln
+51.139 mln
20.72%
jan 1, 1989
459.806 mln
+161.806 mln
54.3%
jan 1, 1990
560.457 mln
+100.651 mln
21.89%
jan 1, 1991
626.613 mln
+66.156 mln
11.8%
jan 1, 1992
617.872 mln
-8.741 mln
-1.39%
jan 1, 1993
724.332 mln
+106.459 mln
17.23%
jan 1, 1994
510.097 mln
-214.235 mln
-29.58%
jan 1, 1995
587.676 mln
+77.578 mln
15.21%
jan 1, 1996
500.431 mln
-87.245 mln
-14.85%
jan 1, 1997
570.134 mln
+69.703 mln
13.93%
jan 1, 1998
611.243 mln
+41.109 mln
7.21%
jan 1, 1999
556.179 mln
-55.064 mln
-9.01%
jan 1, 2000
628.43 mln
+72.251 mln
12.99%
jan 1, 2001
555.117 mln
-73.313 mln
-11.67%
jan 1, 2002
426.865 mln
-128.252 mln
-23.1%
jan 1, 2003
588.031 mln
+161.166 mln
37.76%
jan 1, 2004
578.637 mln
-9.394 mln
-1.6%
jan 1, 2005
752.937 mln
+174.299 mln
30.12%
jan 1, 2006
744.693 mln
-8.244 mln
-1.09%
jan 1, 2007
785.707 mln
+41.014 mln
5.51%
jan 1, 2008
905.235 mln
+119.528 mln
15.21%
jan 1, 2009
1.297 bln
+391.966 mln
43.3%
jan 1, 2010
1.264 bln
-32.993 mln
-2.54%
jan 1, 2011
1.311 bln
+47.045 mln
3.72%
jan 1, 2012
1.442 bln
+131.081 mln
10.0%
jan 1, 2013
1.769 bln
+326.835 mln
22.66%
jan 1, 2014
1.912 bln
+143.124 mln
8.09%
jan 1, 2015
1.714 bln
-198.054 mln
-10.36%
Ranking of countries by current statistics by years


Comments: