29
/
en
AIzaSyAYiBZKx7MnpbEhh9jyipgxe19OcubqV5w
April 1, 2024
247812
Spain
ESP
true
2
1
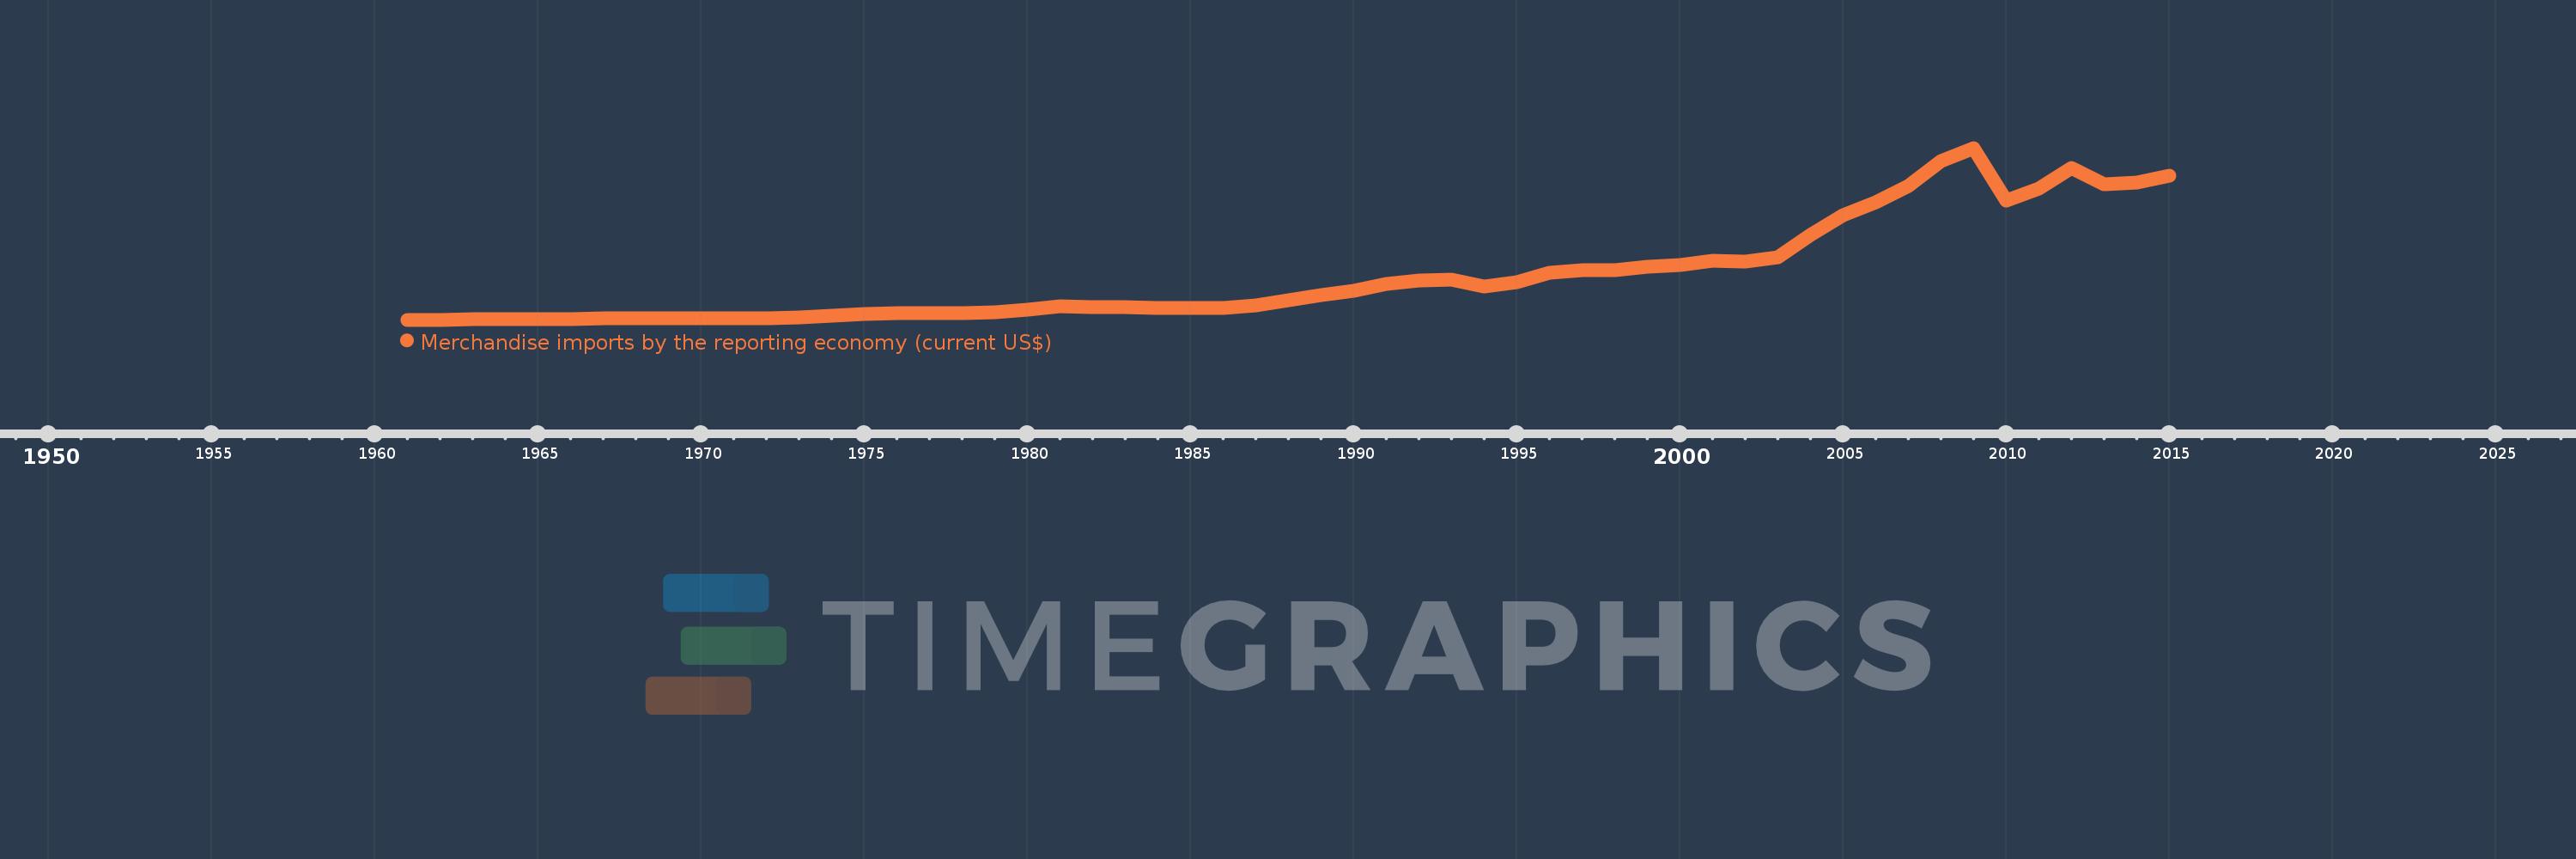
Merchandise imports by the reporting economy (current US$)
2015,2014,2013,2012,2011,2010,2009,2008,2007,2006,2005,2004,2003,2002,2001,2000,1999,1998,1997,1996,1995,1994,1993,1992,1991,1990,1989,1988,1987,1986,1985,1984,1983,1982,1981,1980,1979,1978,1977,1976,1975,1974,1973,1972,1971,1970,1969,1968,1967,1966,1965,1964,1963,1962,1961
This statistics in other country:
AfghanistanAlbaniaAlgeriaAmerican SamoaAngolaAntigua and BarbudaArab WorldArgentinaArmeniaArubaAustraliaAustriaAzerbaijanBahamas, TheBahrainBangladeshBarbadosBelarusBelgiumBelizeBeninBermudaBoliviaBosnia and HerzegovinaBrazilBrunei DarussalamBulgariaBurkina FasoBurundiCabo VerdeCambodiaCameroonCanadaCaribbean small statesCentral African RepublicCentral Europe and the BalticsChadChileChinaColombiaComorosCongo, Dem. Rep.Congo, Rep.Costa RicaCote d'IvoireCroatiaCubaCyprusCzech RepublicDenmarkDjiboutiDominicaDominican RepublicEarly-demographic dividendEast Asia & PacificEast Asia & Pacific (excluding high income)East Asia & Pacific (IDA & IBRD countries)EcuadorEgypt, Arab Rep.El SalvadorEquatorial GuineaEstoniaEthiopiaEuro areaEurope & Central AsiaEurope & Central Asia (excluding high income)Europe & Central Asia (IDA & IBRD countries)European UnionFaroe IslandsFijiFinlandFragile and conflict affected situationsFranceFrench PolynesiaGabonGambia, TheGeorgiaGermanyGhanaGibraltarGreeceGreenlandGrenadaGuamGuatemalaGuineaGuinea-BissauGuyanaHaitiHeavily indebted poor countries (HIPC)High incomeHondurasHong Kong SAR, ChinaHungaryIBRD onlyIcelandIDA & IBRD totalIDA blendIDA onlyIDA totalIndiaIndonesiaIran, Islamic Rep.IraqIrelandIsraelItalyJamaicaJapanJordanKazakhstanKenyaKiribatiKorea, Dem. People’s Rep.Korea, Rep.KosovoKuwaitKyrgyz RepublicLao PDRLate-demographic dividendLatin America & Caribbean Latin America & Caribbean (excluding high income)Latin America & the Caribbean (IDA & IBRD countries)LatviaLeast developed countries: UN classificationLebanonLiberiaLibyaLithuaniaLow & middle incomeLow incomeLower middle incomeLuxembourgMacao SAR, ChinaMacedonia, FYRMadagascarMalawiMalaysiaMaldivesMaliMaltaMauritaniaMauritiusMexicoMiddle East & North AfricaMiddle East & North Africa (excluding high income)Middle East & North Africa (IDA & IBRD countries)Middle incomeMoldovaMongoliaMontenegroMoroccoMozambiqueMyanmarNauruNepalNetherlandsNew CaledoniaNew ZealandNicaraguaNigerNigeriaNorth AmericaNorwayOECD membersOmanOther small statesPacific island small statesPakistanPanamaPapua New GuineaParaguayPeruPhilippinesPolandPortugalPost-demographic dividendPre-demographic dividendQatarRomaniaRussian FederationRwandaSamoaSao Tome and PrincipeSaudi ArabiaSenegalSerbiaSeychellesSierra LeoneSingaporeSlovak RepublicSloveniaSmall statesSolomon IslandsSomaliaSouth AfricaSouth AsiaSouth Asia (IDA & IBRD)SpainSri LankaSt. Kitts and NevisSt. LuciaSt. Vincent and the GrenadinesSub-Saharan Africa Sub-Saharan Africa (excluding high income)Sub-Saharan Africa (IDA & IBRD countries)SudanSurinameSwedenSwitzerlandSyrian Arab RepublicTajikistanTanzaniaThailandTogoTongaTrinidad and TobagoTunisiaTurkeyTurkmenistanTuvaluUgandaUkraineUnited Arab EmiratesUnited KingdomUnited StatesUpper middle incomeUruguayUzbekistanVanuatuVenezuela, RBVietnamWorldYemen, Rep.ZambiaZimbabwe Timeline:
This timeline shows a graph from 1961 to 2015 of Spain. No data until 1960. Number of actual observations by date: 55.
Source name:
World Development Indicators
Source organization:
World Bank staff estimates based data from International Monetary Fund's Direction of Trade database.
Categories, topics:
Private Sector, Trade
Last updated:
apr 23, 2017
Indicators value changes by year
Minimum:
701.3 mln
jan 1, 1961
Maximum:
422.684 bln
jan 1, 2009
At the date of observation
Value
Absolute change
Change from previous value
jan 1, 1961
701.3 mln
+701.3 mln
0.0%
jan 1, 1962
1.077 bln
+375.5 mln
53.54%
jan 1, 1963
1.553 bln
+476.0 mln
44.21%
jan 1, 1964
1.937 bln
+383.7 mln
24.71%
jan 1, 1965
2.241 bln
+304.9 mln
15.74%
jan 1, 1966
3.005 bln
+763.9 mln
34.08%
jan 1, 1967
3.593 bln
+587.7 mln
19.56%
jan 1, 1968
3.482 bln
-110.7 mln
-3.08%
jan 1, 1969
3.511 bln
+29.09 mln
0.84%
jan 1, 1970
4.229 bln
+717.78 mln
20.44%
jan 1, 1971
4.748 bln
+518.88 mln
12.27%
jan 1, 1972
4.965 bln
+216.8 mln
4.57%
jan 1, 1973
6.797 bln
+1.832 bln
36.89%
jan 1, 1974
9.591 bln
+2.794 bln
41.11%
jan 1, 1975
15.38 bln
+5.789 bln
60.36%
jan 1, 1976
16.234 bln
+854.64 mln
5.56%
jan 1, 1977
17.461 bln
+1.227 bln
7.56%
jan 1, 1978
17.834 bln
+372.52 mln
2.13%
jan 1, 1979
18.713 bln
+879.09 mln
4.93%
jan 1, 1980
25.438 bln
+6.725 bln
35.94%
jan 1, 1981
34.077 bln
+8.639 bln
33.96%
jan 1, 1982
32.156 bln
-1.92 bln
-5.64%
jan 1, 1983
31.47 bln
-686.38 mln
-2.13%
jan 1, 1984
29.194 bln
-2.276 bln
-7.23%
jan 1, 1985
28.832 bln
-362.44 mln
-1.24%
jan 1, 1986
29.963 bln
+1.131 bln
3.92%
jan 1, 1987
35.056 bln
+5.093 bln
17.0%
jan 1, 1988
49.112 bln
+14.056 bln
40.1%
jan 1, 1989
60.541 bln
+11.429 bln
23.27%
jan 1, 1990
70.953 bln
+10.411 bln
17.2%
jan 1, 1991
87.814 bln
+16.861 bln
23.76%
jan 1, 1992
96.657 bln
+8.844 bln
10.07%
jan 1, 1993
99.833 bln
+3.176 bln
3.29%
jan 1, 1994
81.859 bln
-17.974 bln
-18.0%
jan 1, 1995
92.182 bln
+10.323 bln
12.61%
jan 1, 1996
115.501 bln
+23.319 bln
25.3%
jan 1, 1997
121.864 bln
+6.363 bln
5.51%
jan 1, 1998
122.753 bln
+888.978 mln
0.73%
jan 1, 1999
130.074 bln
+7.32 bln
5.96%
jan 1, 2000
135.067 bln
+4.994 bln
3.84%
jan 1, 2001
144.679 bln
+9.611 bln
7.12%
jan 1, 2002
142.624 bln
-2.055 bln
-1.42%
jan 1, 2003
154.756 bln
+12.132 bln
8.51%
jan 1, 2004
208.772 bln
+54.017 bln
34.9%
jan 1, 2005
258.289 bln
+49.517 bln
23.72%
jan 1, 2006
288.979 bln
+30.69 bln
11.88%
jan 1, 2007
328.87 bln
+39.891 bln
13.8%
jan 1, 2008
389.619 bln
+60.749 bln
18.47%
jan 1, 2009
422.684 bln
+33.065 bln
8.49%
jan 1, 2010
293.529 bln
-129.155 bln
-30.56%
jan 1, 2011
323.672 bln
+30.143 bln
10.27%
jan 1, 2012
373.371 bln
+49.699 bln
15.35%
jan 1, 2013
334.469 bln
-38.902 bln
-10.42%
jan 1, 2014
337.821 bln
+3.352 bln
1.0%
jan 1, 2015
355.18 bln
+17.359 bln
5.14%
Ranking of countries by current statistics by years


Comments: