29
/
en
AIzaSyAYiBZKx7MnpbEhh9jyipgxe19OcubqV5w
April 1, 2024
156283
Indonesia
IDN
true
2
1
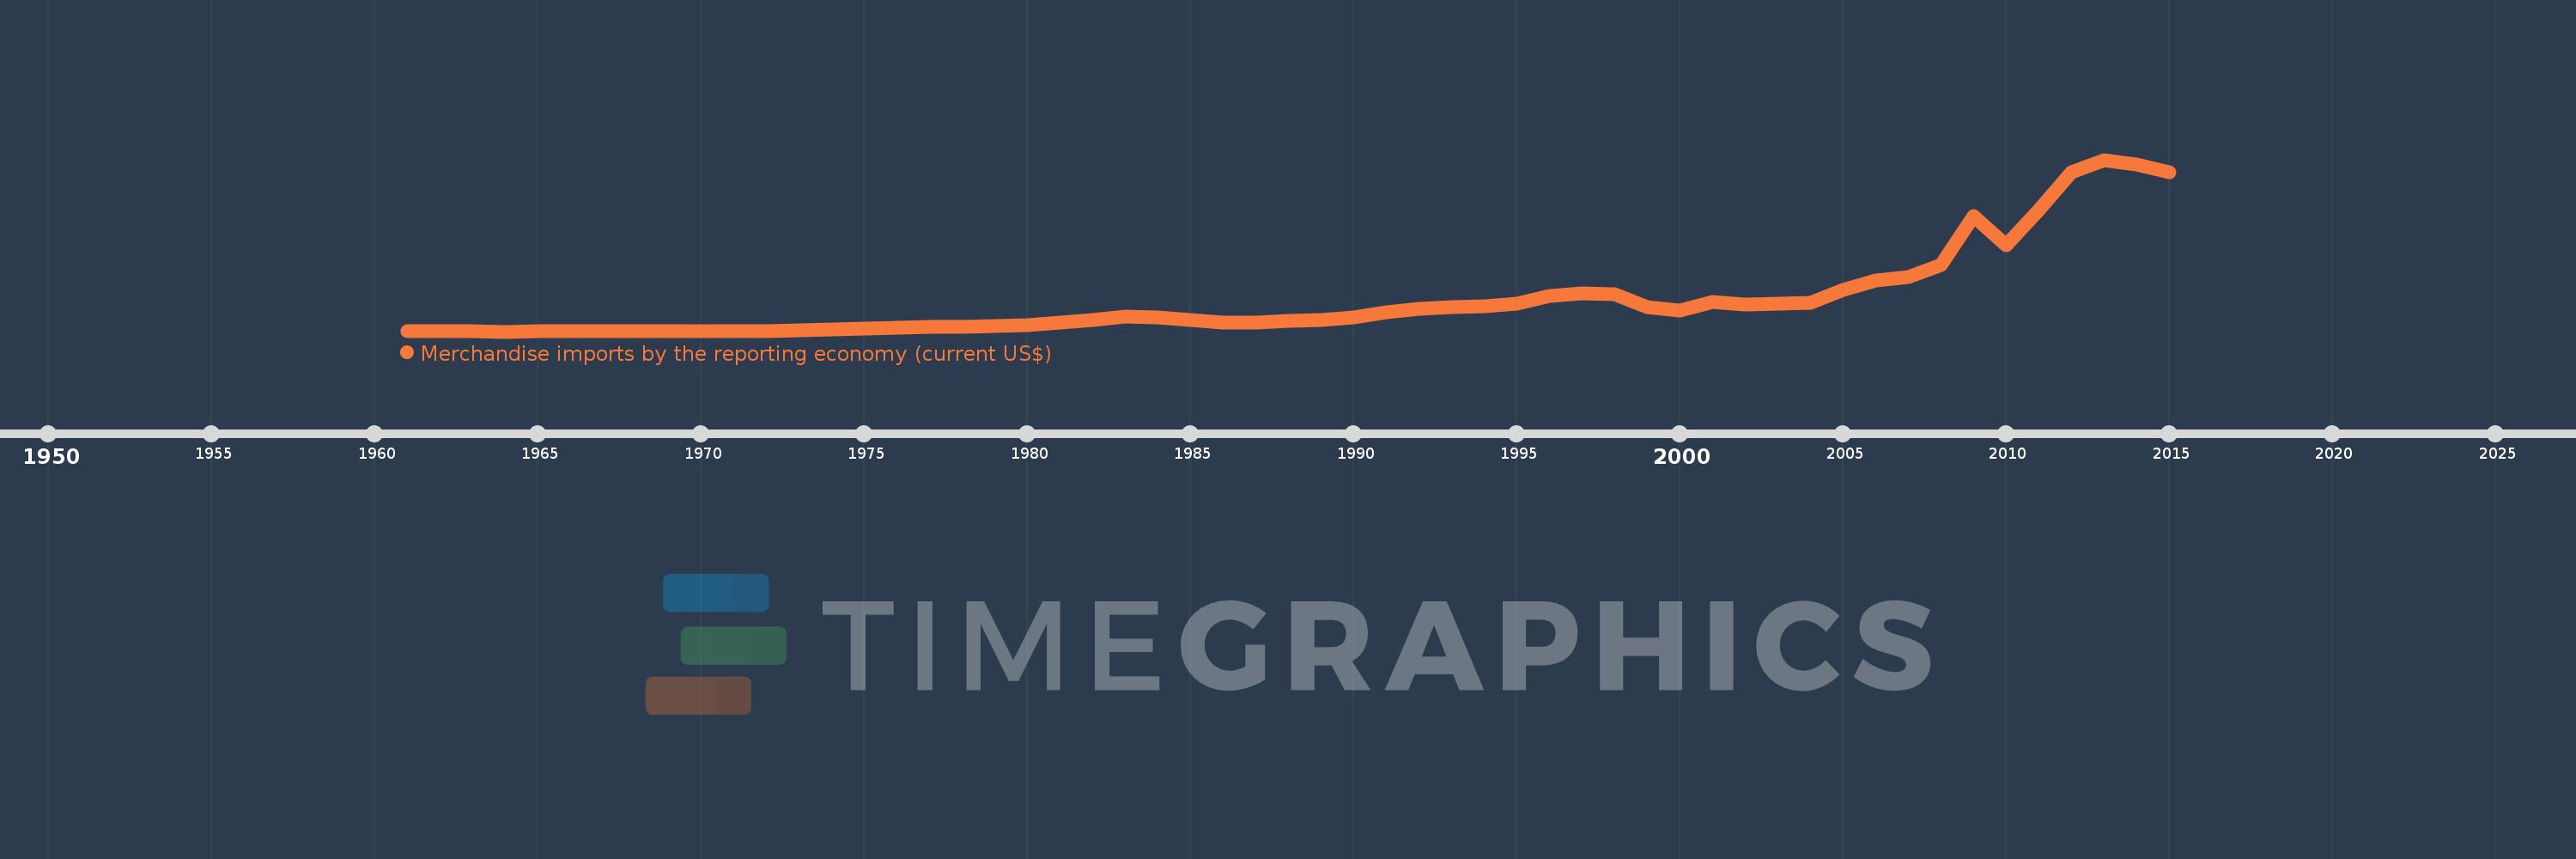
Merchandise imports by the reporting economy (current US$)
2015,2014,2013,2012,2011,2010,2009,2008,2007,2006,2005,2004,2003,2002,2001,2000,1999,1998,1997,1996,1995,1994,1993,1992,1991,1990,1989,1988,1987,1986,1985,1984,1983,1982,1981,1980,1979,1978,1977,1976,1975,1974,1973,1972,1971,1970,1969,1968,1967,1966,1965,1964,1963,1962,1961
This statistics in other country:
AfghanistanAlbaniaAlgeriaAmerican SamoaAngolaAntigua and BarbudaArab WorldArgentinaArmeniaArubaAustraliaAustriaAzerbaijanBahamas, TheBahrainBangladeshBarbadosBelarusBelgiumBelizeBeninBermudaBoliviaBosnia and HerzegovinaBrazilBrunei DarussalamBulgariaBurkina FasoBurundiCabo VerdeCambodiaCameroonCanadaCaribbean small statesCentral African RepublicCentral Europe and the BalticsChadChileChinaColombiaComorosCongo, Dem. Rep.Congo, Rep.Costa RicaCote d'IvoireCroatiaCubaCyprusCzech RepublicDenmarkDjiboutiDominicaDominican RepublicEarly-demographic dividendEast Asia & PacificEast Asia & Pacific (excluding high income)East Asia & Pacific (IDA & IBRD countries)EcuadorEgypt, Arab Rep.El SalvadorEquatorial GuineaEstoniaEthiopiaEuro areaEurope & Central AsiaEurope & Central Asia (excluding high income)Europe & Central Asia (IDA & IBRD countries)European UnionFaroe IslandsFijiFinlandFragile and conflict affected situationsFranceFrench PolynesiaGabonGambia, TheGeorgiaGermanyGhanaGibraltarGreeceGreenlandGrenadaGuamGuatemalaGuineaGuinea-BissauGuyanaHaitiHeavily indebted poor countries (HIPC)High incomeHondurasHong Kong SAR, ChinaHungaryIBRD onlyIcelandIDA & IBRD totalIDA blendIDA onlyIDA totalIndiaIndonesiaIran, Islamic Rep.IraqIrelandIsraelItalyJamaicaJapanJordanKazakhstanKenyaKiribatiKorea, Dem. People’s Rep.Korea, Rep.KosovoKuwaitKyrgyz RepublicLao PDRLate-demographic dividendLatin America & Caribbean Latin America & Caribbean (excluding high income)Latin America & the Caribbean (IDA & IBRD countries)LatviaLeast developed countries: UN classificationLebanonLiberiaLibyaLithuaniaLow & middle incomeLow incomeLower middle incomeLuxembourgMacao SAR, ChinaMacedonia, FYRMadagascarMalawiMalaysiaMaldivesMaliMaltaMauritaniaMauritiusMexicoMiddle East & North AfricaMiddle East & North Africa (excluding high income)Middle East & North Africa (IDA & IBRD countries)Middle incomeMoldovaMongoliaMontenegroMoroccoMozambiqueMyanmarNauruNepalNetherlandsNew CaledoniaNew ZealandNicaraguaNigerNigeriaNorth AmericaNorwayOECD membersOmanOther small statesPacific island small statesPakistanPanamaPapua New GuineaParaguayPeruPhilippinesPolandPortugalPost-demographic dividendPre-demographic dividendQatarRomaniaRussian FederationRwandaSamoaSao Tome and PrincipeSaudi ArabiaSenegalSerbiaSeychellesSierra LeoneSingaporeSlovak RepublicSloveniaSmall statesSolomon IslandsSomaliaSouth AfricaSouth AsiaSouth Asia (IDA & IBRD)SpainSri LankaSt. Kitts and NevisSt. LuciaSt. Vincent and the GrenadinesSub-Saharan Africa Sub-Saharan Africa (excluding high income)Sub-Saharan Africa (IDA & IBRD countries)SudanSurinameSwedenSwitzerlandSyrian Arab RepublicTajikistanTanzaniaThailandTogoTongaTrinidad and TobagoTunisiaTurkeyTurkmenistanTuvaluUgandaUkraineUnited Arab EmiratesUnited KingdomUnited StatesUpper middle incomeUruguayUzbekistanVanuatuVenezuela, RBVietnamWorldYemen, Rep.ZambiaZimbabwe Timeline:
This timeline shows a graph from 1961 to 2015 of Indonesia. No data until 1960. Number of actual observations by date: 55.
Source name:
World Development Indicators
Source organization:
World Bank staff estimates based data from International Monetary Fund's Direction of Trade database.
Categories, topics:
Private Sector, Trade
Last updated:
apr 23, 2017
Indicators value changes by year
Minimum:
502.2 mln
jan 1, 1964
Maximum:
191.691 bln
jan 1, 2013
At the date of observation
Value
Absolute change
Change from previous value
jan 1, 1961
618.0 mln
+618.0 mln
0.0%
jan 1, 1962
766.6 mln
+148.6 mln
24.05%
jan 1, 1963
632.4 mln
-134.2 mln
-17.51%
jan 1, 1964
502.2 mln
-130.2 mln
-20.59%
jan 1, 1965
653.5 mln
+151.3 mln
30.13%
jan 1, 1966
659.0 mln
+5.5 mln
0.84%
jan 1, 1967
504.7 mln
-154.3 mln
-23.41%
jan 1, 1968
637.5 mln
+132.8 mln
26.31%
jan 1, 1969
707.8 mln
+70.3 mln
11.03%
jan 1, 1970
771.5 mln
+63.7 mln
9.0%
jan 1, 1971
984.6 mln
+213.1 mln
27.62%
jan 1, 1972
1.096 bln
+111.7 mln
11.34%
jan 1, 1973
1.557 bln
+460.6 mln
42.01%
jan 1, 1974
2.709 bln
+1.152 bln
74.02%
jan 1, 1975
3.842 bln
+1.132 bln
41.8%
jan 1, 1976
4.769 bln
+927.7 mln
24.15%
jan 1, 1977
5.674 bln
+904.3 mln
18.96%
jan 1, 1978
6.229 bln
+554.8 mln
9.78%
jan 1, 1979
6.69 bln
+461.7 mln
7.41%
jan 1, 1980
7.226 bln
+535.4 mln
8.0%
jan 1, 1981
10.837 bln
+3.612 bln
49.98%
jan 1, 1982
13.27 bln
+2.432 bln
22.44%
jan 1, 1983
16.859 bln
+3.589 bln
27.05%
jan 1, 1984
16.352 bln
-507.3 mln
-3.01%
jan 1, 1985
13.88 bln
-2.471 bln
-15.11%
jan 1, 1986
10.275 bln
-3.605 bln
-25.98%
jan 1, 1987
10.725 bln
+449.7 mln
4.38%
jan 1, 1988
12.855 bln
+2.131 bln
19.87%
jan 1, 1989
13.489 bln
+633.5 mln
4.93%
jan 1, 1990
16.47 bln
+2.981 bln
22.1%
jan 1, 1991
22.005 bln
+5.535 bln
33.61%
jan 1, 1992
25.928 bln
+3.923 bln
17.83%
jan 1, 1993
27.28 bln
+1.351 bln
5.21%
jan 1, 1994
28.328 bln
+1.048 bln
3.84%
jan 1, 1995
32.013 bln
+3.685 bln
13.01%
jan 1, 1996
40.629 bln
+8.616 bln
26.91%
jan 1, 1997
42.902 bln
+2.273 bln
5.59%
jan 1, 1998
41.698 bln
-1.204 bln
-2.81%
jan 1, 1999
27.35 bln
-14.349 bln
-34.41%
jan 1, 2000
24.003 bln
-3.346 bln
-12.24%
jan 1, 2001
33.515 bln
+9.512 bln
39.63%
jan 1, 2002
30.962 bln
-2.553 bln
-7.62%
jan 1, 2003
31.289 bln
+326.711 mln
1.06%
jan 1, 2004
32.551 bln
+1.262 bln
4.03%
jan 1, 2005
46.525 bln
+13.974 bln
42.93%
jan 1, 2006
57.701 bln
+11.176 bln
24.02%
jan 1, 2007
61.065 bln
+3.365 bln
5.83%
jan 1, 2008
74.473 bln
+13.408 bln
21.96%
jan 1, 2009
129.244 bln
+54.771 bln
73.54%
jan 1, 2010
96.829 bln
-32.415 bln
-25.08%
jan 1, 2011
135.663 bln
+38.834 bln
40.11%
jan 1, 2012
177.435 bln
+41.772 bln
30.79%
jan 1, 2013
191.691 bln
+14.256 bln
8.03%
jan 1, 2014
186.628 bln
-5.063 bln
-2.64%
jan 1, 2015
178.179 bln
-8.449 bln
-4.53%
Ranking of countries by current statistics by years


Comments: