29
/
en
AIzaSyAYiBZKx7MnpbEhh9jyipgxe19OcubqV5w
April 1, 2024
168801
Kiribati
KIR
true
2
1
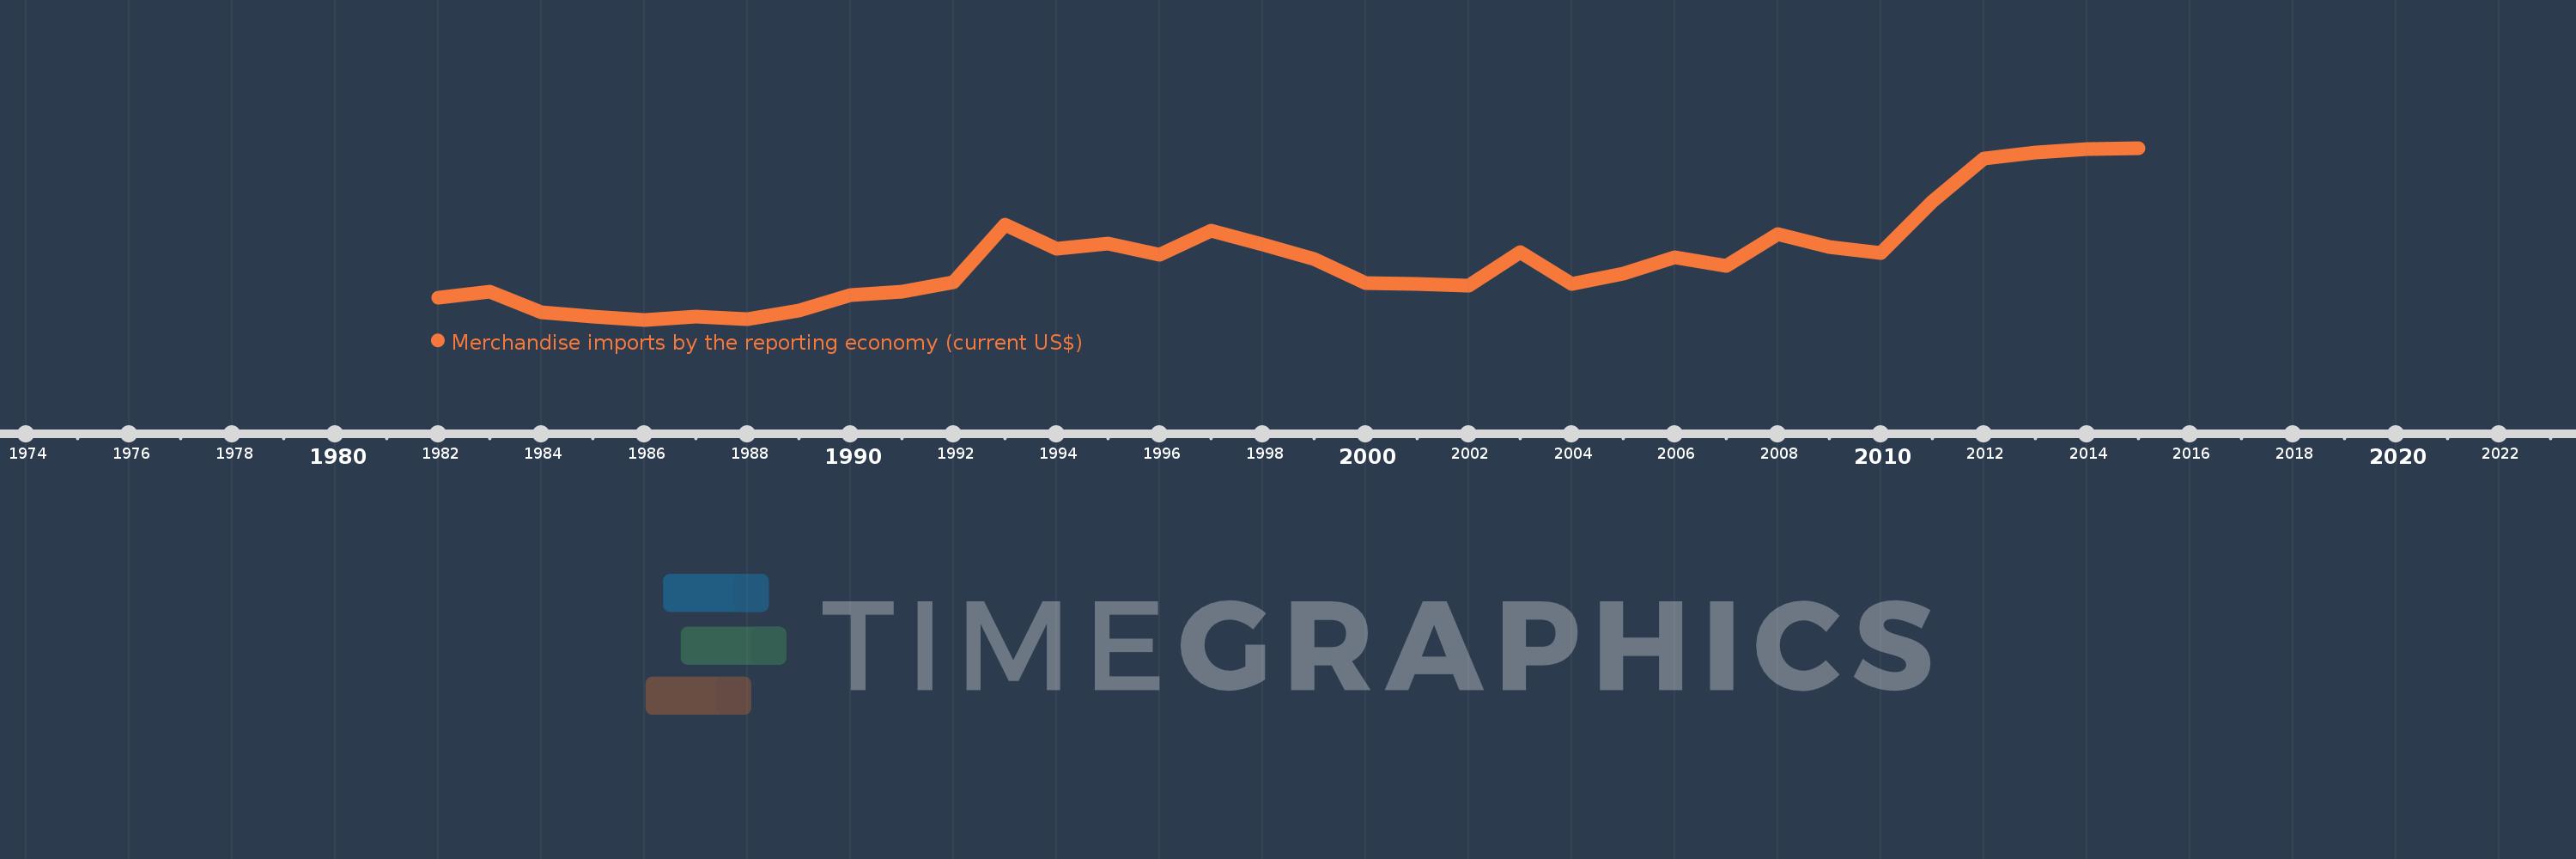
Merchandise imports by the reporting economy (current US$)
2015,2014,2013,2012,2011,2010,2009,2008,2007,2006,2005,2004,2003,2002,2001,2000,1999,1998,1997,1996,1995,1994,1993,1992,1991,1990,1989,1988,1987,1986,1985,1984,1983,1982
This statistics in other country:
AfghanistanAlbaniaAlgeriaAmerican SamoaAngolaAntigua and BarbudaArab WorldArgentinaArmeniaArubaAustraliaAustriaAzerbaijanBahamas, TheBahrainBangladeshBarbadosBelarusBelgiumBelizeBeninBermudaBoliviaBosnia and HerzegovinaBrazilBrunei DarussalamBulgariaBurkina FasoBurundiCabo VerdeCambodiaCameroonCanadaCaribbean small statesCentral African RepublicCentral Europe and the BalticsChadChileChinaColombiaComorosCongo, Dem. Rep.Congo, Rep.Costa RicaCote d'IvoireCroatiaCubaCyprusCzech RepublicDenmarkDjiboutiDominicaDominican RepublicEarly-demographic dividendEast Asia & PacificEast Asia & Pacific (excluding high income)East Asia & Pacific (IDA & IBRD countries)EcuadorEgypt, Arab Rep.El SalvadorEquatorial GuineaEstoniaEthiopiaEuro areaEurope & Central AsiaEurope & Central Asia (excluding high income)Europe & Central Asia (IDA & IBRD countries)European UnionFaroe IslandsFijiFinlandFragile and conflict affected situationsFranceFrench PolynesiaGabonGambia, TheGeorgiaGermanyGhanaGibraltarGreeceGreenlandGrenadaGuamGuatemalaGuineaGuinea-BissauGuyanaHaitiHeavily indebted poor countries (HIPC)High incomeHondurasHong Kong SAR, ChinaHungaryIBRD onlyIcelandIDA & IBRD totalIDA blendIDA onlyIDA totalIndiaIndonesiaIran, Islamic Rep.IraqIrelandIsraelItalyJamaicaJapanJordanKazakhstanKenyaKiribatiKorea, Dem. People’s Rep.Korea, Rep.KosovoKuwaitKyrgyz RepublicLao PDRLate-demographic dividendLatin America & Caribbean Latin America & Caribbean (excluding high income)Latin America & the Caribbean (IDA & IBRD countries)LatviaLeast developed countries: UN classificationLebanonLiberiaLibyaLithuaniaLow & middle incomeLow incomeLower middle incomeLuxembourgMacao SAR, ChinaMacedonia, FYRMadagascarMalawiMalaysiaMaldivesMaliMaltaMauritaniaMauritiusMexicoMiddle East & North AfricaMiddle East & North Africa (excluding high income)Middle East & North Africa (IDA & IBRD countries)Middle incomeMoldovaMongoliaMontenegroMoroccoMozambiqueMyanmarNauruNepalNetherlandsNew CaledoniaNew ZealandNicaraguaNigerNigeriaNorth AmericaNorwayOECD membersOmanOther small statesPacific island small statesPakistanPanamaPapua New GuineaParaguayPeruPhilippinesPolandPortugalPost-demographic dividendPre-demographic dividendQatarRomaniaRussian FederationRwandaSamoaSao Tome and PrincipeSaudi ArabiaSenegalSerbiaSeychellesSierra LeoneSingaporeSlovak RepublicSloveniaSmall statesSolomon IslandsSomaliaSouth AfricaSouth AsiaSouth Asia (IDA & IBRD)SpainSri LankaSt. Kitts and NevisSt. LuciaSt. Vincent and the GrenadinesSub-Saharan Africa Sub-Saharan Africa (excluding high income)Sub-Saharan Africa (IDA & IBRD countries)SudanSurinameSwedenSwitzerlandSyrian Arab RepublicTajikistanTanzaniaThailandTogoTongaTrinidad and TobagoTunisiaTurkeyTurkmenistanTuvaluUgandaUkraineUnited Arab EmiratesUnited KingdomUnited StatesUpper middle incomeUruguayUzbekistanVanuatuVenezuela, RBVietnamWorldYemen, Rep.ZambiaZimbabwe Timeline:
This timeline shows a graph from 1982 to 2015 of Kiribati. No data until 1981. Number of actual observations by date: 34.
Source name:
World Development Indicators
Source organization:
World Bank staff estimates based data from International Monetary Fund's Direction of Trade database.
Categories, topics:
Private Sector, Trade
Last updated:
apr 23, 2017
Indicators value changes by year
Minimum:
15.034 mln
jan 1, 1986
Maximum:
187.618 mln
jan 1, 2015
At the date of observation
Value
Absolute change
Change from previous value
jan 1, 1982
36.922 mln
+36.922 mln
0.0%
jan 1, 1983
42.924 mln
+6.003 mln
16.26%
jan 1, 1984
22.813 mln
-20.111 mln
-46.85%
jan 1, 1985
17.806 mln
-5.007 mln
-21.95%
jan 1, 1986
15.034 mln
-2.772 mln
-15.57%
jan 1, 1987
18.573 mln
+3.54 mln
23.55%
jan 1, 1988
16.013 mln
-2.56 mln
-13.79%
jan 1, 1989
23.94 mln
+7.926 mln
49.5%
jan 1, 1990
39.844 mln
+15.905 mln
66.44%
jan 1, 1991
43.173 mln
+3.328 mln
8.35%
jan 1, 1992
53.107 mln
+9.935 mln
23.01%
jan 1, 1993
110.155 mln
+57.047 mln
107.42%
jan 1, 1994
86.133 mln
-24.021 mln
-21.81%
jan 1, 1995
91.168 mln
+5.034 mln
5.84%
jan 1, 1996
80.214 mln
-10.953 mln
-12.01%
jan 1, 1997
104.204 mln
+23.989 mln
29.91%
jan 1, 1998
90.811 mln
-13.393 mln
-12.85%
jan 1, 1999
75.926 mln
-14.885 mln
-16.39%
jan 1, 2000
51.694 mln
-24.232 mln
-31.91%
jan 1, 2001
50.75 mln
-944.024K
-1.83%
jan 1, 2002
49.056 mln
-1.695 mln
-3.34%
jan 1, 2003
83.051 mln
+33.995 mln
69.3%
jan 1, 2004
50.885 mln
-32.166 mln
-38.73%
jan 1, 2005
61.367 mln
+10.482 mln
20.6%
jan 1, 2006
77.69 mln
+16.324 mln
26.6%
jan 1, 2007
69.119 mln
-8.571 mln
-11.03%
jan 1, 2008
101.367 mln
+32.248 mln
46.66%
jan 1, 2009
87.897 mln
-13.47 mln
-13.29%
jan 1, 2010
82.466 mln
-5.431 mln
-6.18%
jan 1, 2011
134.007 mln
+51.541 mln
62.5%
jan 1, 2012
177.154 mln
+43.147 mln
32.2%
jan 1, 2013
183.135 mln
+5.982 mln
3.38%
jan 1, 2014
186.499 mln
+3.363 mln
1.84%
jan 1, 2015
187.618 mln
+1.12 mln
0.6%
Ranking of countries by current statistics by years


Comments: