29
/
en
AIzaSyAYiBZKx7MnpbEhh9jyipgxe19OcubqV5w
April 1, 2024
261189
Tanzania
TZA
true
2
1
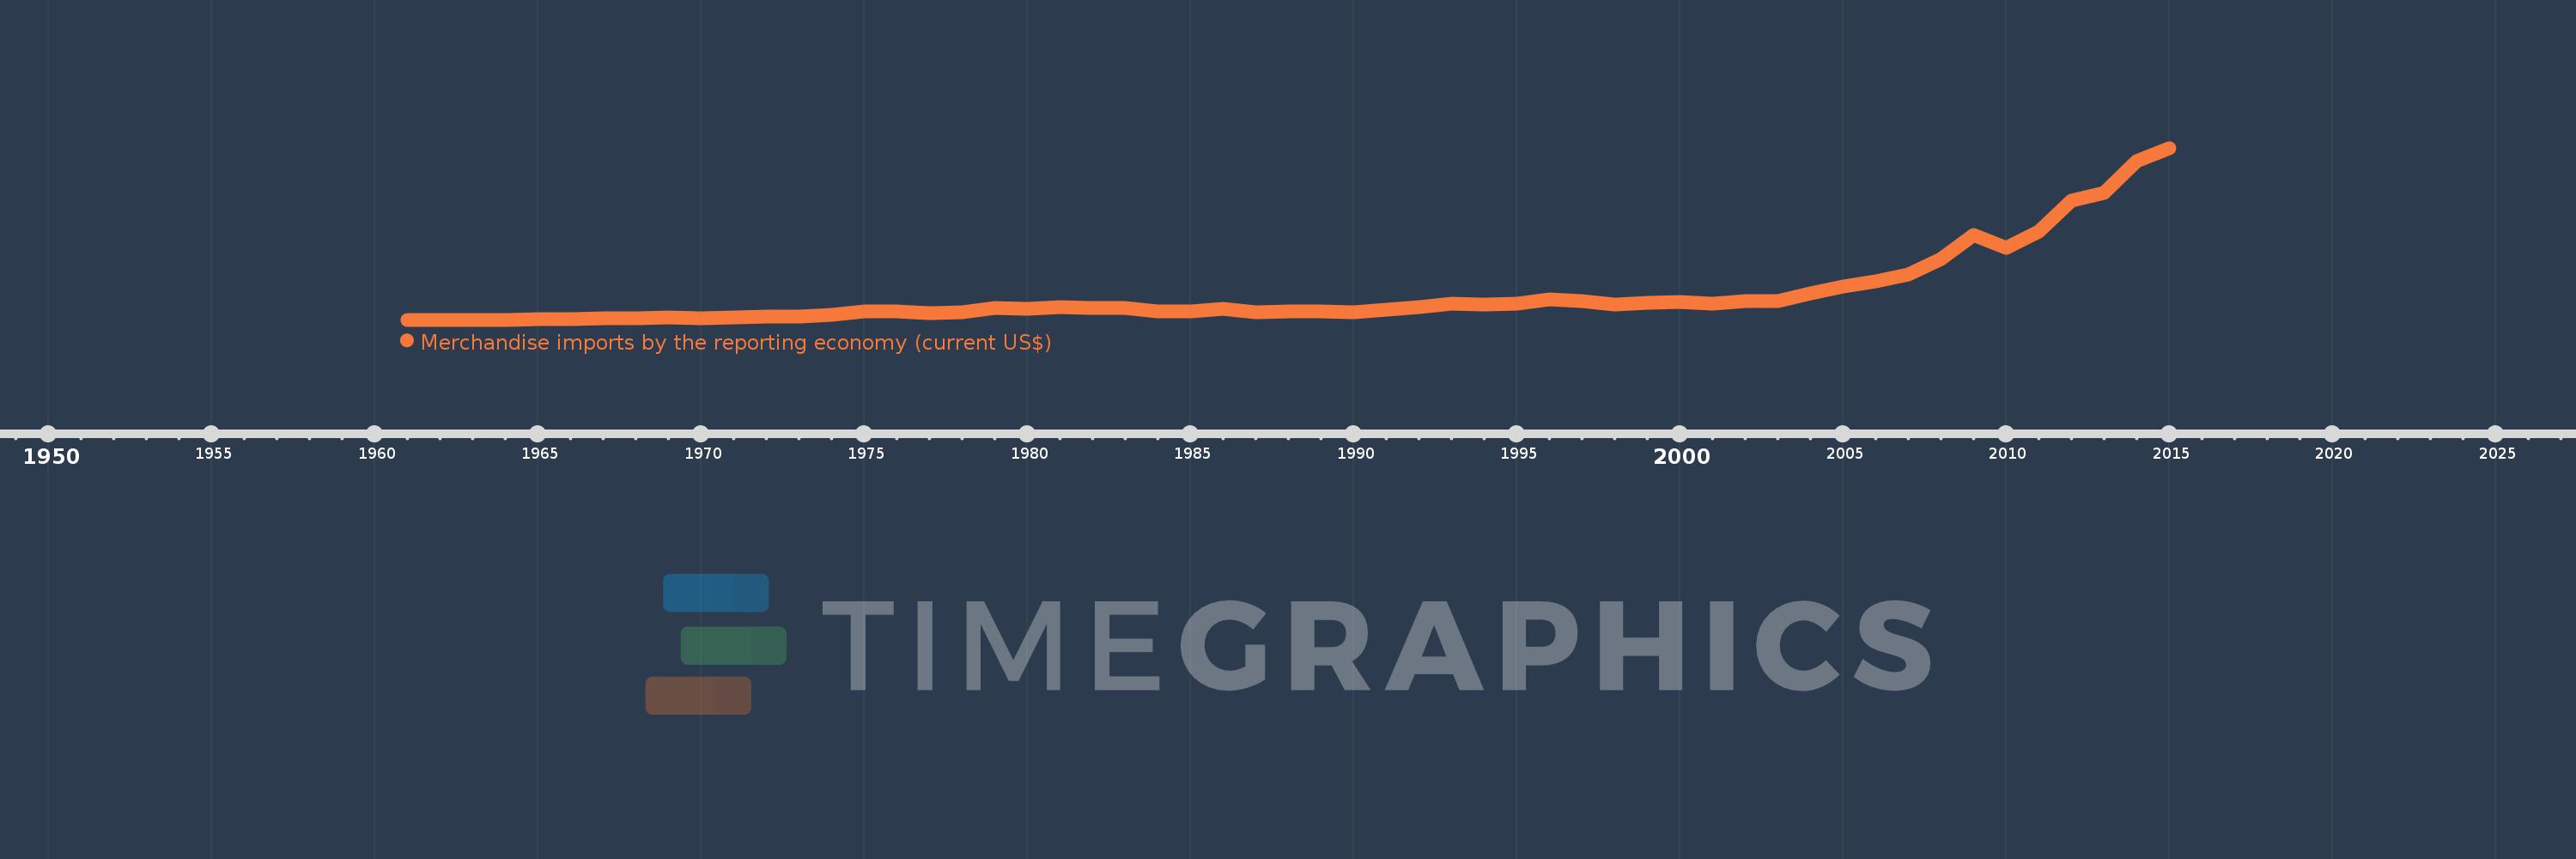
Merchandise imports by the reporting economy (current US$)
2015,2014,2013,2012,2011,2010,2009,2008,2007,2006,2005,2004,2003,2002,2001,2000,1999,1998,1997,1996,1995,1994,1993,1992,1991,1990,1989,1988,1987,1986,1985,1984,1983,1982,1981,1980,1979,1978,1977,1976,1975,1974,1973,1972,1971,1970,1969,1968,1967,1966,1965,1964,1963,1962,1961
This statistics in other country:
AfghanistanAlbaniaAlgeriaAmerican SamoaAngolaAntigua and BarbudaArab WorldArgentinaArmeniaArubaAustraliaAustriaAzerbaijanBahamas, TheBahrainBangladeshBarbadosBelarusBelgiumBelizeBeninBermudaBoliviaBosnia and HerzegovinaBrazilBrunei DarussalamBulgariaBurkina FasoBurundiCabo VerdeCambodiaCameroonCanadaCaribbean small statesCentral African RepublicCentral Europe and the BalticsChadChileChinaColombiaComorosCongo, Dem. Rep.Congo, Rep.Costa RicaCote d'IvoireCroatiaCubaCyprusCzech RepublicDenmarkDjiboutiDominicaDominican RepublicEarly-demographic dividendEast Asia & PacificEast Asia & Pacific (excluding high income)East Asia & Pacific (IDA & IBRD countries)EcuadorEgypt, Arab Rep.El SalvadorEquatorial GuineaEstoniaEthiopiaEuro areaEurope & Central AsiaEurope & Central Asia (excluding high income)Europe & Central Asia (IDA & IBRD countries)European UnionFaroe IslandsFijiFinlandFragile and conflict affected situationsFranceFrench PolynesiaGabonGambia, TheGeorgiaGermanyGhanaGibraltarGreeceGreenlandGrenadaGuamGuatemalaGuineaGuinea-BissauGuyanaHaitiHeavily indebted poor countries (HIPC)High incomeHondurasHong Kong SAR, ChinaHungaryIBRD onlyIcelandIDA & IBRD totalIDA blendIDA onlyIDA totalIndiaIndonesiaIran, Islamic Rep.IraqIrelandIsraelItalyJamaicaJapanJordanKazakhstanKenyaKiribatiKorea, Dem. People’s Rep.Korea, Rep.KosovoKuwaitKyrgyz RepublicLao PDRLate-demographic dividendLatin America & Caribbean Latin America & Caribbean (excluding high income)Latin America & the Caribbean (IDA & IBRD countries)LatviaLeast developed countries: UN classificationLebanonLiberiaLibyaLithuaniaLow & middle incomeLow incomeLower middle incomeLuxembourgMacao SAR, ChinaMacedonia, FYRMadagascarMalawiMalaysiaMaldivesMaliMaltaMauritaniaMauritiusMexicoMiddle East & North AfricaMiddle East & North Africa (excluding high income)Middle East & North Africa (IDA & IBRD countries)Middle incomeMoldovaMongoliaMontenegroMoroccoMozambiqueMyanmarNauruNepalNetherlandsNew CaledoniaNew ZealandNicaraguaNigerNigeriaNorth AmericaNorwayOECD membersOmanOther small statesPacific island small statesPakistanPanamaPapua New GuineaParaguayPeruPhilippinesPolandPortugalPost-demographic dividendPre-demographic dividendQatarRomaniaRussian FederationRwandaSamoaSao Tome and PrincipeSaudi ArabiaSenegalSerbiaSeychellesSierra LeoneSingaporeSlovak RepublicSloveniaSmall statesSolomon IslandsSomaliaSouth AfricaSouth AsiaSouth Asia (IDA & IBRD)SpainSri LankaSt. Kitts and NevisSt. LuciaSt. Vincent and the GrenadinesSub-Saharan Africa Sub-Saharan Africa (excluding high income)Sub-Saharan Africa (IDA & IBRD countries)SudanSurinameSwedenSwitzerlandSyrian Arab RepublicTajikistanTanzaniaThailandTogoTongaTrinidad and TobagoTunisiaTurkeyTurkmenistanTuvaluUgandaUkraineUnited Arab EmiratesUnited KingdomUnited StatesUpper middle incomeUruguayUzbekistanVanuatuVenezuela, RBVietnamWorldYemen, Rep.ZambiaZimbabwe Timeline:
This timeline shows a graph from 1961 to 2015 of Tanzania. No data until 1960. Number of actual observations by date: 55.
Source name:
World Development Indicators
Source organization:
World Bank staff estimates based data from International Monetary Fund's Direction of Trade database.
Categories, topics:
Private Sector, Trade
Last updated:
apr 23, 2017
Indicators value changes by year
Minimum:
82.7 mln
jan 1, 1961
Maximum:
15.49 bln
jan 1, 2015
At the date of observation
Value
Absolute change
Change from previous value
jan 1, 1961
82.7 mln
+82.7 mln
0.0%
jan 1, 1962
86.2 mln
+3.5 mln
4.23%
jan 1, 1963
84.0 mln
-2.2 mln
-2.55%
jan 1, 1964
84.5 mln
+500.0K
0.6%
jan 1, 1965
122.3 mln
+37.8 mln
44.73%
jan 1, 1966
139.4 mln
+17.1 mln
13.98%
jan 1, 1967
179.7 mln
+40.3 mln
28.91%
jan 1, 1968
181.904 mln
+2.204 mln
1.23%
jan 1, 1969
255.381 mln
+73.477 mln
40.39%
jan 1, 1970
237.154 mln
-18.227 mln
-7.14%
jan 1, 1971
318.383 mln
+81.229 mln
34.25%
jan 1, 1972
381.763 mln
+63.38 mln
19.91%
jan 1, 1973
402.909 mln
+21.146 mln
5.54%
jan 1, 1974
488.486 mln
+85.577 mln
21.24%
jan 1, 1975
812.828 mln
+324.342 mln
66.4%
jan 1, 1976
842.523 mln
+29.695 mln
3.65%
jan 1, 1977
656.066 mln
-186.457 mln
-22.13%
jan 1, 1978
729.608 mln
+73.542 mln
11.21%
jan 1, 1979
1.118 bln
+388.665 mln
53.27%
jan 1, 1980
1.08 bln
-38.726 mln
-3.46%
jan 1, 1981
1.227 bln
+147.048 mln
13.62%
jan 1, 1982
1.176 bln
-50.832 mln
-4.14%
jan 1, 1983
1.131 bln
-44.749 mln
-3.81%
jan 1, 1984
796.614 mln
-334.4 mln
-29.57%
jan 1, 1985
847.26 mln
+50.646 mln
6.36%
jan 1, 1986
1.028 bln
+180.782 mln
21.34%
jan 1, 1987
779.839 mln
-248.203 mln
-24.14%
jan 1, 1988
811.846 mln
+32.007 mln
4.1%
jan 1, 1989
822.876 mln
+11.03 mln
1.36%
jan 1, 1990
780.995 mln
-41.881 mln
-5.09%
jan 1, 1991
1.022 bln
+240.548 mln
30.8%
jan 1, 1992
1.231 bln
+209.86 mln
20.54%
jan 1, 1993
1.552 bln
+320.571 mln
26.03%
jan 1, 1994
1.463 bln
-88.609 mln
-5.71%
jan 1, 1995
1.535 bln
+71.179 mln
4.86%
jan 1, 1996
1.879 bln
+344.617 mln
22.46%
jan 1, 1997
1.787 bln
-91.906 mln
-4.89%
jan 1, 1998
1.409 bln
-378.42 mln
-21.17%
jan 1, 1999
1.571 bln
+162.518 mln
11.54%
jan 1, 2000
1.66 bln
+89.004 mln
5.66%
jan 1, 2001
1.521 bln
-139.378 mln
-8.39%
jan 1, 2002
1.78 bln
+259.321 mln
17.05%
jan 1, 2003
1.749 bln
-30.835 mln
-1.73%
jan 1, 2004
2.47 bln
+720.064 mln
41.16%
jan 1, 2005
3.06 bln
+590.746 mln
23.92%
jan 1, 2006
3.562 bln
+501.818 mln
16.4%
jan 1, 2007
4.181 bln
+618.409 mln
17.36%
jan 1, 2008
5.562 bln
+1.382 bln
33.05%
jan 1, 2009
7.687 bln
+2.125 bln
38.2%
jan 1, 2010
6.516 bln
-1.171 bln
-15.23%
jan 1, 2011
7.996 bln
+1.48 bln
22.71%
jan 1, 2012
10.79 bln
+2.794 bln
34.94%
jan 1, 2013
11.43 bln
+640.602 mln
5.94%
jan 1, 2014
14.338 bln
+2.908 bln
25.44%
jan 1, 2015
15.49 bln
+1.152 bln
8.04%
Ranking of countries by current statistics by years


Comments: