29
/
en
AIzaSyAYiBZKx7MnpbEhh9jyipgxe19OcubqV5w
April 1, 2024
256595
Sweden
SWE
true
2
1
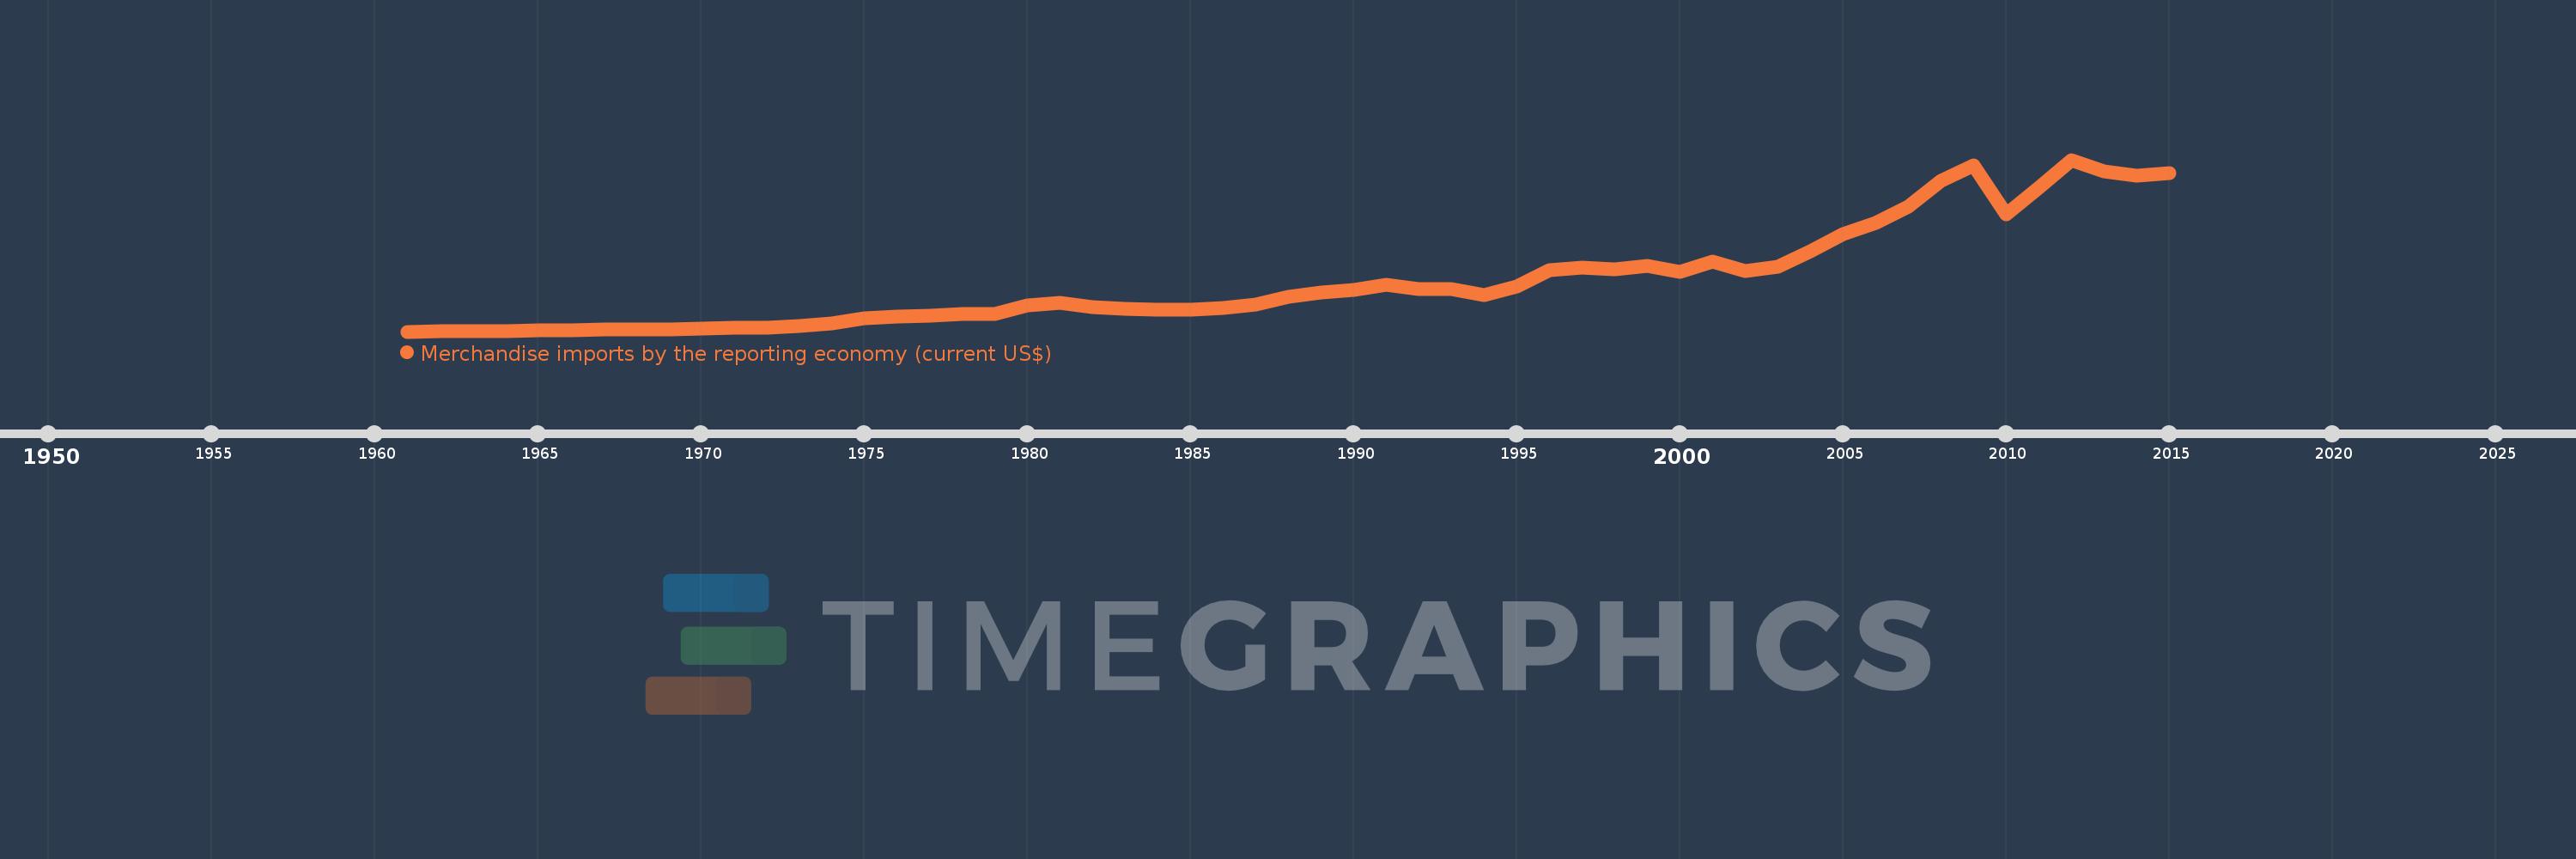
Merchandise imports by the reporting economy (current US$)
2015,2014,2013,2012,2011,2010,2009,2008,2007,2006,2005,2004,2003,2002,2001,2000,1999,1998,1997,1996,1995,1994,1993,1992,1991,1990,1989,1988,1987,1986,1985,1984,1983,1982,1981,1980,1979,1978,1977,1976,1975,1974,1973,1972,1971,1970,1969,1968,1967,1966,1965,1964,1963,1962,1961
This statistics in other country:
AfghanistanAlbaniaAlgeriaAmerican SamoaAngolaAntigua and BarbudaArab WorldArgentinaArmeniaArubaAustraliaAustriaAzerbaijanBahamas, TheBahrainBangladeshBarbadosBelarusBelgiumBelizeBeninBermudaBoliviaBosnia and HerzegovinaBrazilBrunei DarussalamBulgariaBurkina FasoBurundiCabo VerdeCambodiaCameroonCanadaCaribbean small statesCentral African RepublicCentral Europe and the BalticsChadChileChinaColombiaComorosCongo, Dem. Rep.Congo, Rep.Costa RicaCote d'IvoireCroatiaCubaCyprusCzech RepublicDenmarkDjiboutiDominicaDominican RepublicEarly-demographic dividendEast Asia & PacificEast Asia & Pacific (excluding high income)East Asia & Pacific (IDA & IBRD countries)EcuadorEgypt, Arab Rep.El SalvadorEquatorial GuineaEstoniaEthiopiaEuro areaEurope & Central AsiaEurope & Central Asia (excluding high income)Europe & Central Asia (IDA & IBRD countries)European UnionFaroe IslandsFijiFinlandFragile and conflict affected situationsFranceFrench PolynesiaGabonGambia, TheGeorgiaGermanyGhanaGibraltarGreeceGreenlandGrenadaGuamGuatemalaGuineaGuinea-BissauGuyanaHaitiHeavily indebted poor countries (HIPC)High incomeHondurasHong Kong SAR, ChinaHungaryIBRD onlyIcelandIDA & IBRD totalIDA blendIDA onlyIDA totalIndiaIndonesiaIran, Islamic Rep.IraqIrelandIsraelItalyJamaicaJapanJordanKazakhstanKenyaKiribatiKorea, Dem. People’s Rep.Korea, Rep.KosovoKuwaitKyrgyz RepublicLao PDRLate-demographic dividendLatin America & Caribbean Latin America & Caribbean (excluding high income)Latin America & the Caribbean (IDA & IBRD countries)LatviaLeast developed countries: UN classificationLebanonLiberiaLibyaLithuaniaLow & middle incomeLow incomeLower middle incomeLuxembourgMacao SAR, ChinaMacedonia, FYRMadagascarMalawiMalaysiaMaldivesMaliMaltaMauritaniaMauritiusMexicoMiddle East & North AfricaMiddle East & North Africa (excluding high income)Middle East & North Africa (IDA & IBRD countries)Middle incomeMoldovaMongoliaMontenegroMoroccoMozambiqueMyanmarNauruNepalNetherlandsNew CaledoniaNew ZealandNicaraguaNigerNigeriaNorth AmericaNorwayOECD membersOmanOther small statesPacific island small statesPakistanPanamaPapua New GuineaParaguayPeruPhilippinesPolandPortugalPost-demographic dividendPre-demographic dividendQatarRomaniaRussian FederationRwandaSamoaSao Tome and PrincipeSaudi ArabiaSenegalSerbiaSeychellesSierra LeoneSingaporeSlovak RepublicSloveniaSmall statesSolomon IslandsSomaliaSouth AfricaSouth AsiaSouth Asia (IDA & IBRD)SpainSri LankaSt. Kitts and NevisSt. LuciaSt. Vincent and the GrenadinesSub-Saharan Africa Sub-Saharan Africa (excluding high income)Sub-Saharan Africa (IDA & IBRD countries)SudanSurinameSwedenSwitzerlandSyrian Arab RepublicTajikistanTanzaniaThailandTogoTongaTrinidad and TobagoTunisiaTurkeyTurkmenistanTuvaluUgandaUkraineUnited Arab EmiratesUnited KingdomUnited StatesUpper middle incomeUruguayUzbekistanVanuatuVenezuela, RBVietnamWorldYemen, Rep.ZambiaZimbabwe Timeline:
This timeline shows a graph from 1961 to 2015 of Sweden. No data until 1960. Number of actual observations by date: 55.
Source name:
World Development Indicators
Source organization:
World Bank staff estimates based data from International Monetary Fund's Direction of Trade database.
Categories, topics:
Private Sector, Trade
Last updated:
apr 23, 2017
Indicators value changes by year
Minimum:
2.836 bln
jan 1, 1961
Maximum:
174.763 bln
jan 1, 2012
At the date of observation
Value
Absolute change
Change from previous value
jan 1, 1961
2.836 bln
+2.836 bln
0.0%
jan 1, 1962
2.895 bln
+59.3 mln
2.09%
jan 1, 1963
3.084 bln
+189.7 mln
6.55%
jan 1, 1964
3.362 bln
+277.8 mln
9.01%
jan 1, 1965
3.839 bln
+476.5 mln
14.17%
jan 1, 1966
4.363 bln
+524.1 mln
13.65%
jan 1, 1967
4.568 bln
+205.4 mln
4.71%
jan 1, 1968
4.698 bln
+129.6 mln
2.84%
jan 1, 1969
5.117 bln
+419.3 mln
8.93%
jan 1, 1970
5.903 bln
+785.8 mln
15.36%
jan 1, 1971
7.005 bln
+1.102 bln
18.67%
jan 1, 1972
7.076 bln
+70.9 mln
1.01%
jan 1, 1973
8.062 bln
+985.6 mln
13.93%
jan 1, 1974
10.626 bln
+2.564 bln
31.8%
jan 1, 1975
16.456 bln
+5.831 bln
54.88%
jan 1, 1976
18.031 bln
+1.574 bln
9.57%
jan 1, 1977
19.157 bln
+1.126 bln
6.25%
jan 1, 1978
20.114 bln
+957.4 mln
5.0%
jan 1, 1979
20.587 bln
+472.5 mln
2.35%
jan 1, 1980
28.735 bln
+8.149 bln
39.58%
jan 1, 1981
31.388 bln
+2.653 bln
9.23%
jan 1, 1982
27.066 bln
-4.322 bln
-13.77%
jan 1, 1983
26.007 bln
-1.059 bln
-3.91%
jan 1, 1984
24.545 bln
-1.461 bln
-5.62%
jan 1, 1985
24.645 bln
+99.6 mln
0.41%
jan 1, 1986
26.365 bln
+1.72 bln
6.98%
jan 1, 1987
29.827 bln
+3.461 bln
13.13%
jan 1, 1988
37.575 bln
+7.748 bln
25.98%
jan 1, 1989
42.072 bln
+4.498 bln
11.97%
jan 1, 1990
44.844 bln
+2.771 bln
6.59%
jan 1, 1991
49.354 bln
+4.51 bln
10.06%
jan 1, 1992
45.406 bln
-3.948 bln
-8.0%
jan 1, 1993
45.536 bln
+129.469 mln
0.29%
jan 1, 1994
39.055 bln
-6.481 bln
-14.23%
jan 1, 1995
48.052 bln
+8.997 bln
23.04%
jan 1, 1996
64.568 bln
+16.516 bln
34.37%
jan 1, 1997
66.584 bln
+2.016 bln
3.12%
jan 1, 1998
65.437 bln
-1.147 bln
-1.72%
jan 1, 1999
68.238 bln
+2.801 bln
4.28%
jan 1, 2000
62.695 bln
-5.543 bln
-8.12%
jan 1, 2001
72.954 bln
+10.259 bln
16.36%
jan 1, 2002
63.542 bln
-9.413 bln
-12.9%
jan 1, 2003
67.451 bln
+3.909 bln
6.15%
jan 1, 2004
83.259 bln
+15.808 bln
23.44%
jan 1, 2005
100.221 bln
+16.962 bln
20.37%
jan 1, 2006
111.593 bln
+11.373 bln
11.35%
jan 1, 2007
127.692 bln
+16.098 bln
14.43%
jan 1, 2008
153.429 bln
+25.738 bln
20.16%
jan 1, 2009
169.064 bln
+15.634 bln
10.19%
jan 1, 2010
120.099 bln
-48.965 bln
-28.96%
jan 1, 2011
147.018 bln
+26.919 bln
22.41%
jan 1, 2012
174.763 bln
+27.745 bln
18.87%
jan 1, 2013
162.882 bln
-11.881 bln
-6.8%
jan 1, 2014
158.999 bln
-3.883 bln
-2.38%
jan 1, 2015
161.114 bln
+2.115 bln
1.33%
Ranking of countries by current statistics by years


Comments: