29
/
en
AIzaSyAYiBZKx7MnpbEhh9jyipgxe19OcubqV5w
April 1, 2024
121167
Dominica
DMA
true
2
1
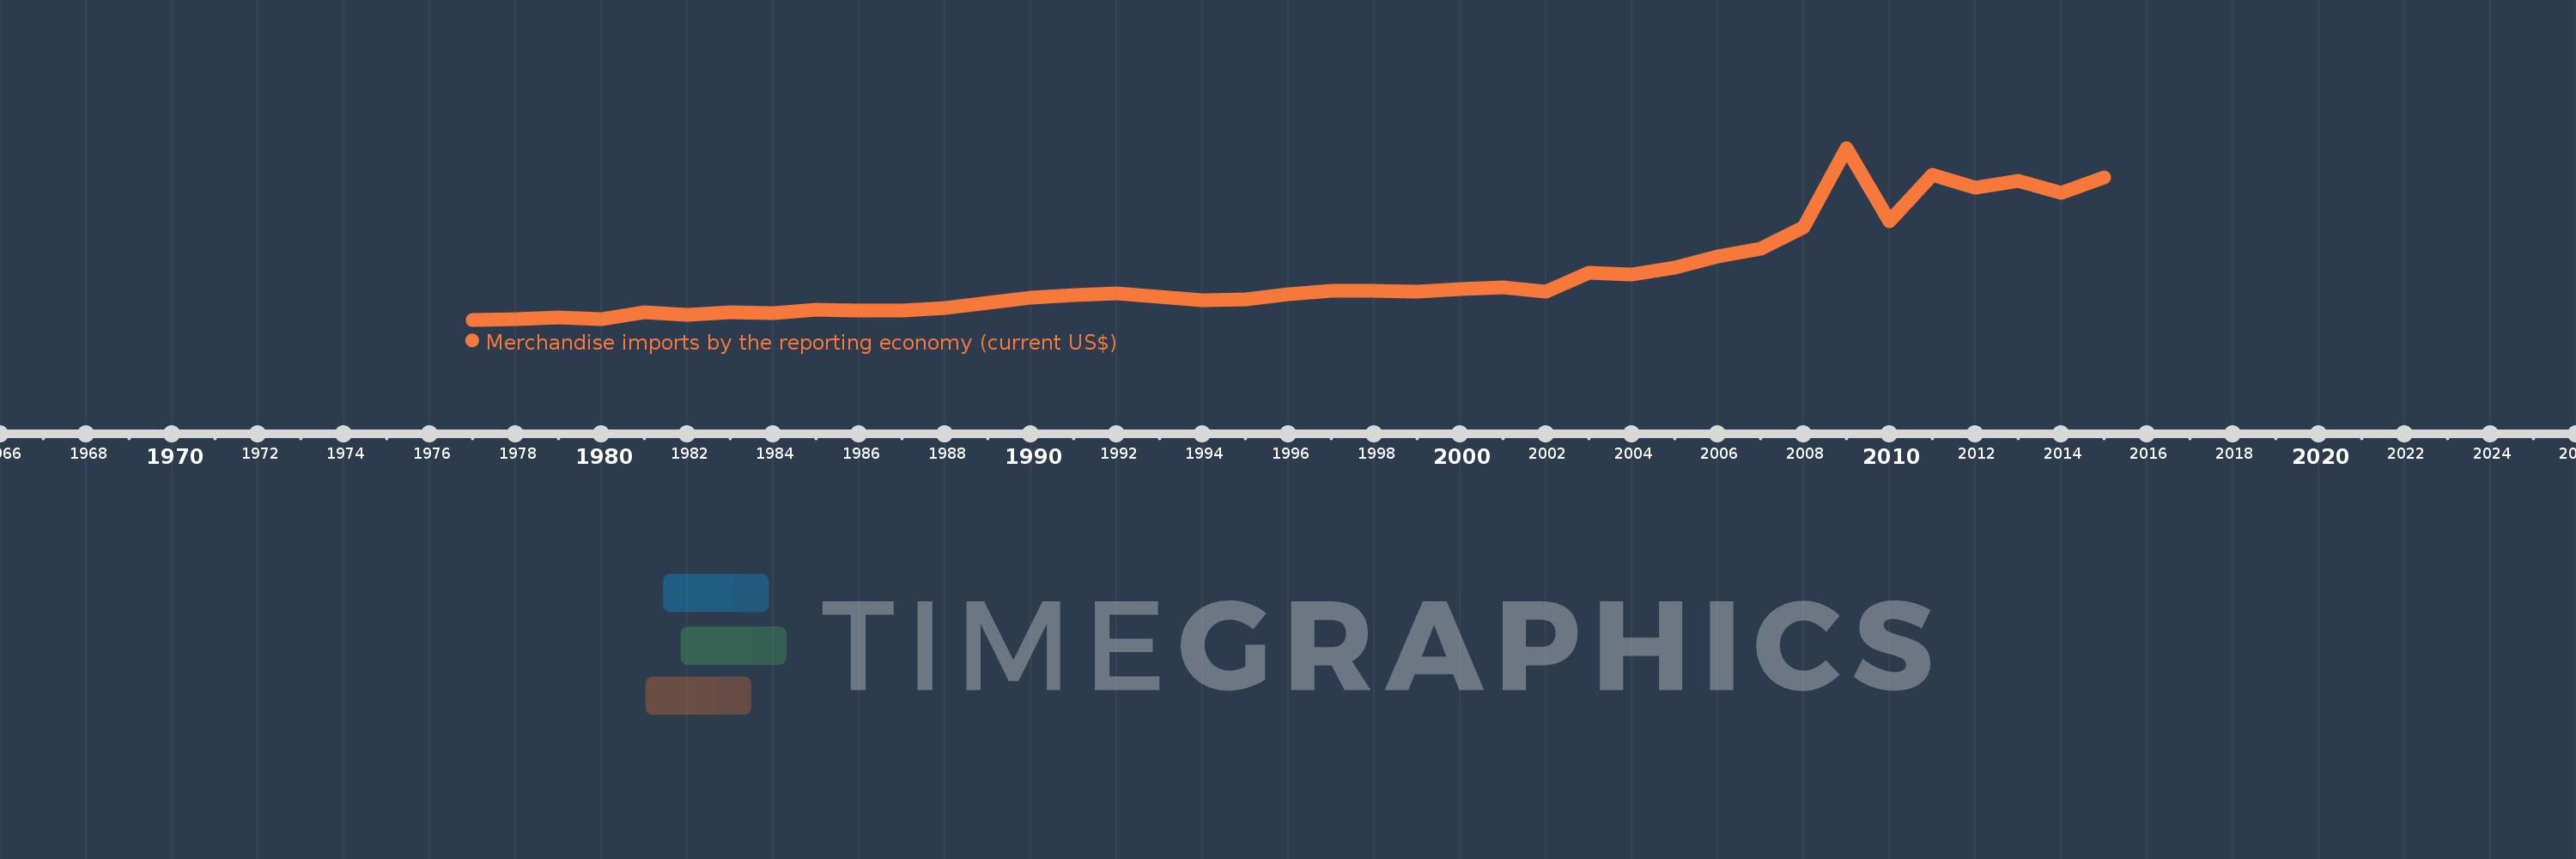
Merchandise imports by the reporting economy (current US$)
2015,2014,2013,2012,2011,2010,2009,2008,2007,2006,2005,2004,2003,2002,2001,2000,1999,1998,1997,1996,1995,1994,1993,1992,1991,1990,1989,1988,1987,1986,1985,1984,1983,1982,1981,1980,1979,1978,1977
This statistics in other country:
AfghanistanAlbaniaAlgeriaAmerican SamoaAngolaAntigua and BarbudaArab WorldArgentinaArmeniaArubaAustraliaAustriaAzerbaijanBahamas, TheBahrainBangladeshBarbadosBelarusBelgiumBelizeBeninBermudaBoliviaBosnia and HerzegovinaBrazilBrunei DarussalamBulgariaBurkina FasoBurundiCabo VerdeCambodiaCameroonCanadaCaribbean small statesCentral African RepublicCentral Europe and the BalticsChadChileChinaColombiaComorosCongo, Dem. Rep.Congo, Rep.Costa RicaCote d'IvoireCroatiaCubaCyprusCzech RepublicDenmarkDjiboutiDominicaDominican RepublicEarly-demographic dividendEast Asia & PacificEast Asia & Pacific (excluding high income)East Asia & Pacific (IDA & IBRD countries)EcuadorEgypt, Arab Rep.El SalvadorEquatorial GuineaEstoniaEthiopiaEuro areaEurope & Central AsiaEurope & Central Asia (excluding high income)Europe & Central Asia (IDA & IBRD countries)European UnionFaroe IslandsFijiFinlandFragile and conflict affected situationsFranceFrench PolynesiaGabonGambia, TheGeorgiaGermanyGhanaGibraltarGreeceGreenlandGrenadaGuamGuatemalaGuineaGuinea-BissauGuyanaHaitiHeavily indebted poor countries (HIPC)High incomeHondurasHong Kong SAR, ChinaHungaryIBRD onlyIcelandIDA & IBRD totalIDA blendIDA onlyIDA totalIndiaIndonesiaIran, Islamic Rep.IraqIrelandIsraelItalyJamaicaJapanJordanKazakhstanKenyaKiribatiKorea, Dem. People’s Rep.Korea, Rep.KosovoKuwaitKyrgyz RepublicLao PDRLate-demographic dividendLatin America & Caribbean Latin America & Caribbean (excluding high income)Latin America & the Caribbean (IDA & IBRD countries)LatviaLeast developed countries: UN classificationLebanonLiberiaLibyaLithuaniaLow & middle incomeLow incomeLower middle incomeLuxembourgMacao SAR, ChinaMacedonia, FYRMadagascarMalawiMalaysiaMaldivesMaliMaltaMauritaniaMauritiusMexicoMiddle East & North AfricaMiddle East & North Africa (excluding high income)Middle East & North Africa (IDA & IBRD countries)Middle incomeMoldovaMongoliaMontenegroMoroccoMozambiqueMyanmarNauruNepalNetherlandsNew CaledoniaNew ZealandNicaraguaNigerNigeriaNorth AmericaNorwayOECD membersOmanOther small statesPacific island small statesPakistanPanamaPapua New GuineaParaguayPeruPhilippinesPolandPortugalPost-demographic dividendPre-demographic dividendQatarRomaniaRussian FederationRwandaSamoaSao Tome and PrincipeSaudi ArabiaSenegalSerbiaSeychellesSierra LeoneSingaporeSlovak RepublicSloveniaSmall statesSolomon IslandsSomaliaSouth AfricaSouth AsiaSouth Asia (IDA & IBRD)SpainSri LankaSt. Kitts and NevisSt. LuciaSt. Vincent and the GrenadinesSub-Saharan Africa Sub-Saharan Africa (excluding high income)Sub-Saharan Africa (IDA & IBRD countries)SudanSurinameSwedenSwitzerlandSyrian Arab RepublicTajikistanTanzaniaThailandTogoTongaTrinidad and TobagoTunisiaTurkeyTurkmenistanTuvaluUgandaUkraineUnited Arab EmiratesUnited KingdomUnited StatesUpper middle incomeUruguayUzbekistanVanuatuVenezuela, RBVietnamWorldYemen, Rep.ZambiaZimbabwe Timeline:
This timeline shows a graph from 1977 to 2015 of Dominica. No data until 1976. Number of actual observations by date: 39.
Source name:
World Development Indicators
Source organization:
World Bank staff estimates based data from International Monetary Fund's Direction of Trade database.
Categories, topics:
Private Sector, Trade
Last updated:
apr 23, 2017
Indicators value changes by year
Minimum:
19.06 mln
jan 1, 1977
Maximum:
702.976 mln
jan 1, 2009
At the date of observation
Value
Absolute change
Change from previous value
jan 1, 1977
19.06 mln
+19.06 mln
0.0%
jan 1, 1978
21.879 mln
+2.819 mln
14.79%
jan 1, 1979
28.434 mln
+6.555 mln
29.96%
jan 1, 1980
22.21 mln
-6.224 mln
-21.89%
jan 1, 1981
47.675 mln
+25.465 mln
114.66%
jan 1, 1982
38.07 mln
-9.605 mln
-20.15%
jan 1, 1983
47.476 mln
+9.406 mln
24.71%
jan 1, 1984
45.071 mln
-2.405 mln
-5.07%
jan 1, 1985
57.849 mln
+12.778 mln
28.35%
jan 1, 1986
55.325 mln
-2.525 mln
-4.36%
jan 1, 1987
55.81 mln
+485.353K
0.88%
jan 1, 1988
66.376 mln
+10.566 mln
18.93%
jan 1, 1989
87.531 mln
+21.155 mln
31.87%
jan 1, 1990
107.075 mln
+19.544 mln
22.33%
jan 1, 1991
117.923 mln
+10.848 mln
10.13%
jan 1, 1992
122.66 mln
+4.737 mln
4.02%
jan 1, 1993
109.353 mln
-13.307 mln
-10.85%
jan 1, 1994
97.08 mln
-12.273 mln
-11.22%
jan 1, 1995
99.765 mln
+2.684 mln
2.77%
jan 1, 1996
121.488 mln
+21.724 mln
21.77%
jan 1, 1997
134.874 mln
+13.386 mln
11.02%
jan 1, 1998
134.497 mln
-377.108K
-0.28%
jan 1, 1999
132.219 mln
-2.278 mln
-1.69%
jan 1, 2000
140.225 mln
+8.006 mln
6.05%
jan 1, 2001
147.278 mln
+7.053 mln
5.03%
jan 1, 2002
130.895 mln
-16.383 mln
-11.12%
jan 1, 2003
204.705 mln
+73.81 mln
56.39%
jan 1, 2004
200.702 mln
-4.003 mln
-1.96%
jan 1, 2005
227.615 mln
+26.913 mln
13.41%
jan 1, 2006
270.019 mln
+42.404 mln
18.63%
jan 1, 2007
302.525 mln
+32.506 mln
12.04%
jan 1, 2008
386.65 mln
+84.124 mln
27.81%
jan 1, 2009
702.976 mln
+316.327 mln
81.81%
jan 1, 2010
411.809 mln
-291.167 mln
-41.42%
jan 1, 2011
596.635 mln
+184.825 mln
44.88%
jan 1, 2012
544.564 mln
-52.071 mln
-8.73%
jan 1, 2013
573.014 mln
+28.45 mln
5.22%
jan 1, 2014
524.36 mln
-48.653 mln
-8.49%
jan 1, 2015
586.453 mln
+62.093 mln
11.84%
Ranking of countries by current statistics by years


Comments: