29
/
en
AIzaSyAYiBZKx7MnpbEhh9jyipgxe19OcubqV5w
April 1, 2024
103867
Chad
TCD
true
2
1
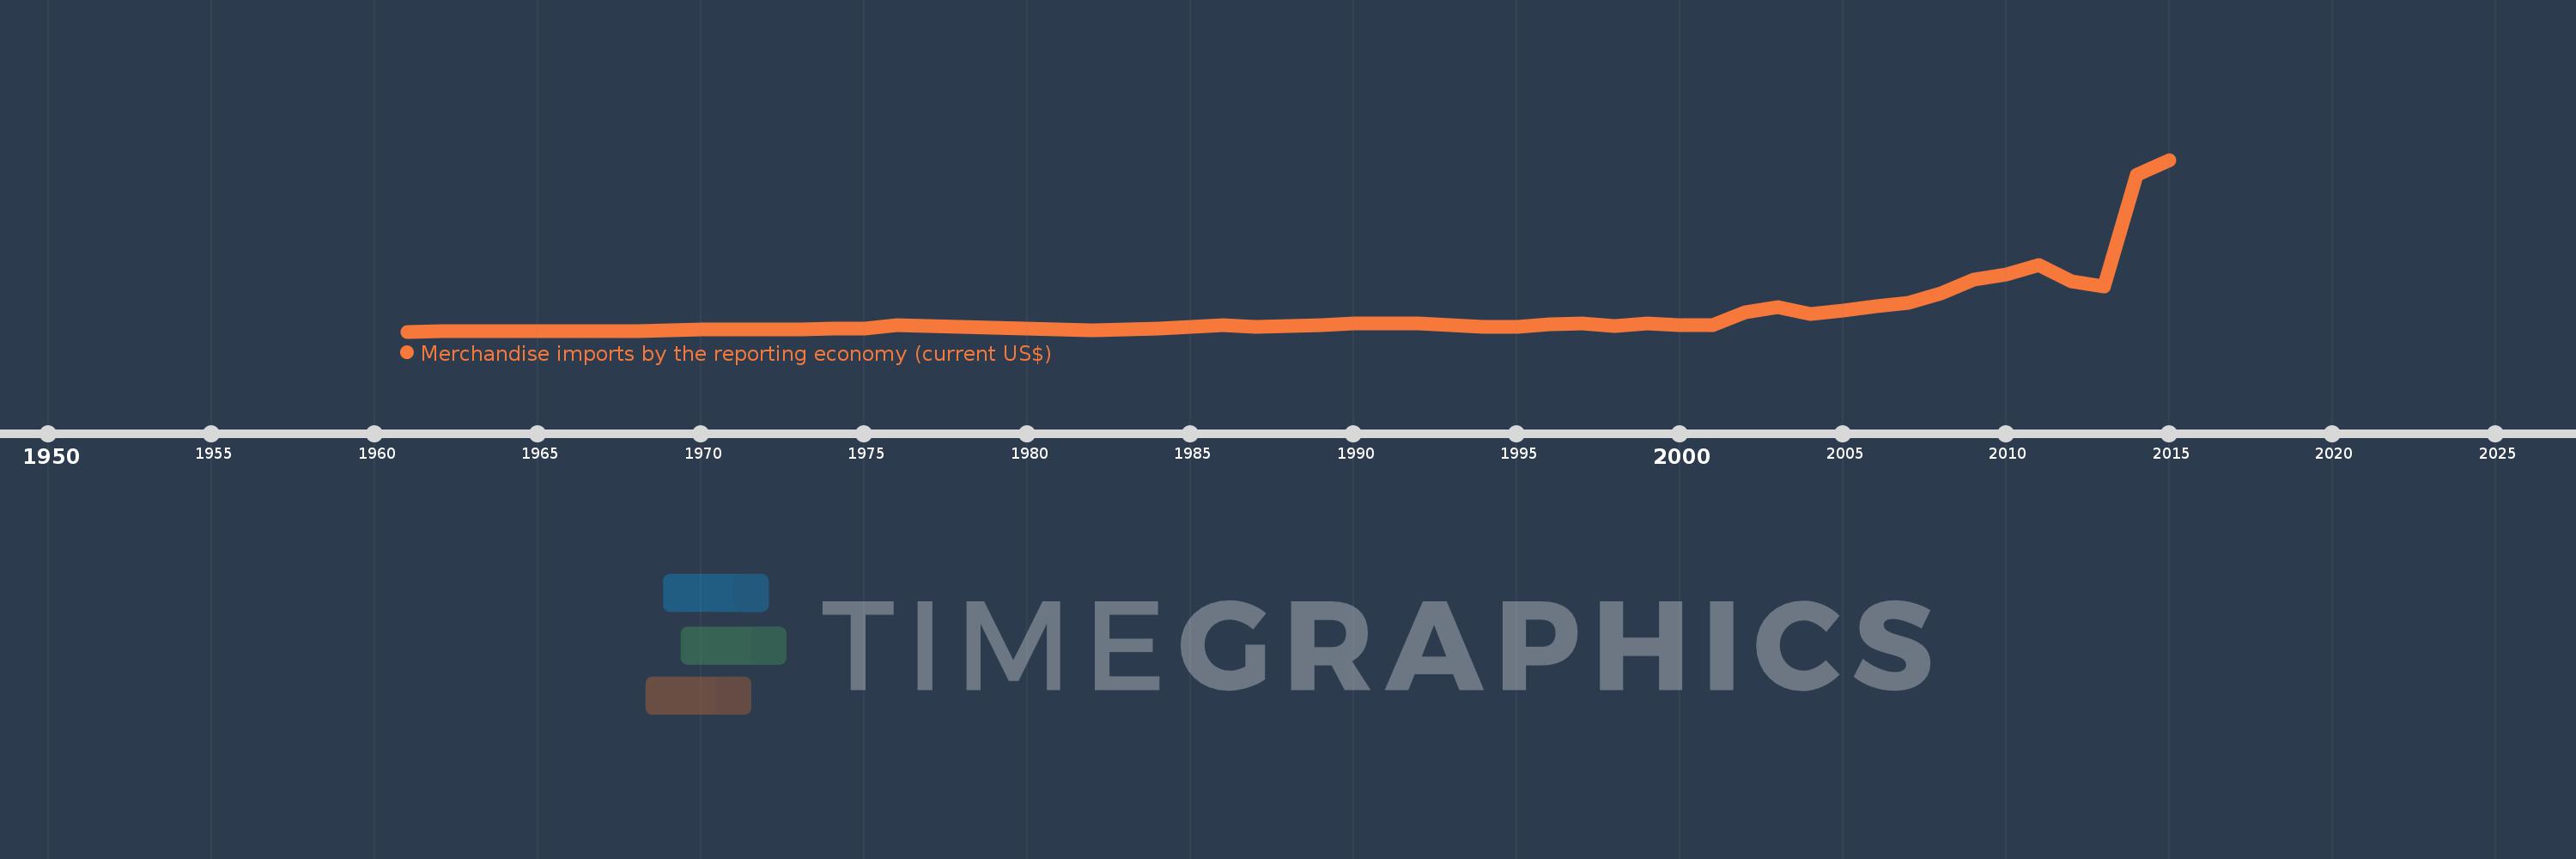
Merchandise imports by the reporting economy (current US$)
2015,2014,2013,2012,2011,2010,2009,2008,2007,2006,2005,2004,2003,2002,2001,2000,1999,1998,1997,1996,1995,1994,1993,1992,1991,1990,1989,1988,1987,1986,1985,1984,1983,1982,1976,1975,1974,1973,1972,1971,1970,1969,1968,1967,1966,1965,1964,1963,1962,1961
This statistics in other country:
AfghanistanAlbaniaAlgeriaAmerican SamoaAngolaAntigua and BarbudaArab WorldArgentinaArmeniaArubaAustraliaAustriaAzerbaijanBahamas, TheBahrainBangladeshBarbadosBelarusBelgiumBelizeBeninBermudaBoliviaBosnia and HerzegovinaBrazilBrunei DarussalamBulgariaBurkina FasoBurundiCabo VerdeCambodiaCameroonCanadaCaribbean small statesCentral African RepublicCentral Europe and the BalticsChadChileChinaColombiaComorosCongo, Dem. Rep.Congo, Rep.Costa RicaCote d'IvoireCroatiaCubaCyprusCzech RepublicDenmarkDjiboutiDominicaDominican RepublicEarly-demographic dividendEast Asia & PacificEast Asia & Pacific (excluding high income)East Asia & Pacific (IDA & IBRD countries)EcuadorEgypt, Arab Rep.El SalvadorEquatorial GuineaEstoniaEthiopiaEuro areaEurope & Central AsiaEurope & Central Asia (excluding high income)Europe & Central Asia (IDA & IBRD countries)European UnionFaroe IslandsFijiFinlandFragile and conflict affected situationsFranceFrench PolynesiaGabonGambia, TheGeorgiaGermanyGhanaGibraltarGreeceGreenlandGrenadaGuamGuatemalaGuineaGuinea-BissauGuyanaHaitiHeavily indebted poor countries (HIPC)High incomeHondurasHong Kong SAR, ChinaHungaryIBRD onlyIcelandIDA & IBRD totalIDA blendIDA onlyIDA totalIndiaIndonesiaIran, Islamic Rep.IraqIrelandIsraelItalyJamaicaJapanJordanKazakhstanKenyaKiribatiKorea, Dem. People’s Rep.Korea, Rep.KosovoKuwaitKyrgyz RepublicLao PDRLate-demographic dividendLatin America & Caribbean Latin America & Caribbean (excluding high income)Latin America & the Caribbean (IDA & IBRD countries)LatviaLeast developed countries: UN classificationLebanonLiberiaLibyaLithuaniaLow & middle incomeLow incomeLower middle incomeLuxembourgMacao SAR, ChinaMacedonia, FYRMadagascarMalawiMalaysiaMaldivesMaliMaltaMauritaniaMauritiusMexicoMiddle East & North AfricaMiddle East & North Africa (excluding high income)Middle East & North Africa (IDA & IBRD countries)Middle incomeMoldovaMongoliaMontenegroMoroccoMozambiqueMyanmarNauruNepalNetherlandsNew CaledoniaNew ZealandNicaraguaNigerNigeriaNorth AmericaNorwayOECD membersOmanOther small statesPacific island small statesPakistanPanamaPapua New GuineaParaguayPeruPhilippinesPolandPortugalPost-demographic dividendPre-demographic dividendQatarRomaniaRussian FederationRwandaSamoaSao Tome and PrincipeSaudi ArabiaSenegalSerbiaSeychellesSierra LeoneSingaporeSlovak RepublicSloveniaSmall statesSolomon IslandsSomaliaSouth AfricaSouth AsiaSouth Asia (IDA & IBRD)SpainSri LankaSt. Kitts and NevisSt. LuciaSt. Vincent and the GrenadinesSub-Saharan Africa Sub-Saharan Africa (excluding high income)Sub-Saharan Africa (IDA & IBRD countries)SudanSurinameSwedenSwitzerlandSyrian Arab RepublicTajikistanTanzaniaThailandTogoTongaTrinidad and TobagoTunisiaTurkeyTurkmenistanTuvaluUgandaUkraineUnited Arab EmiratesUnited KingdomUnited StatesUpper middle incomeUruguayUzbekistanVanuatuVenezuela, RBVietnamWorldYemen, Rep.ZambiaZimbabwe Timeline:
This timeline shows a graph from 1961 to 2015 of Chad. No data until 1960. Number of actual observations by date: 50.
Source name:
World Development Indicators
Source organization:
World Bank staff estimates based data from International Monetary Fund's Direction of Trade database.
Categories, topics:
Private Sector, Trade
Last updated:
apr 23, 2017
Indicators value changes by year
Minimum:
25.0 mln
jan 1, 1961
Maximum:
3.117 bln
jan 1, 2015
At the date of observation
Value
Absolute change
Change from previous value
jan 1, 1961
25.0 mln
+25.0 mln
0.0%
jan 1, 1962
25.1 mln
+100.0K
0.4%
jan 1, 1963
29.2 mln
+4.1 mln
16.33%
jan 1, 1964
29.0 mln
-200.0K
-0.68%
jan 1, 1965
34.8 mln
+5.8 mln
20.0%
jan 1, 1966
30.9 mln
-3.9 mln
-11.21%
jan 1, 1967
31.8 mln
+900.0K
2.91%
jan 1, 1968
39.9 mln
+8.1 mln
25.47%
jan 1, 1969
53.6 mln
+13.7 mln
34.34%
jan 1, 1970
57.299 mln
+3.699 mln
6.9%
jan 1, 1971
64.988 mln
+7.689 mln
13.42%
jan 1, 1972
61.51 mln
-3.478 mln
-5.35%
jan 1, 1973
61.287 mln
-223.0K
-0.36%
jan 1, 1974
84.31 mln
+23.023 mln
37.57%
jan 1, 1975
86.731 mln
+2.421 mln
2.87%
jan 1, 1976
133.263 mln
+46.532 mln
53.65%
jan 1, 1982
55.164 mln
-78.099 mln
-58.61%
jan 1, 1983
63.514 mln
+8.35 mln
15.14%
jan 1, 1984
83.715 mln
+20.201 mln
31.81%
jan 1, 1985
114.002 mln
+30.287 mln
36.18%
jan 1, 1986
145.525 mln
+31.523 mln
27.65%
jan 1, 1987
106.251 mln
-39.275 mln
-26.99%
jan 1, 1988
126.685 mln
+20.435 mln
19.23%
jan 1, 1989
144.73 mln
+18.045 mln
14.24%
jan 1, 1990
175.719 mln
+30.989 mln
21.41%
jan 1, 1991
167.49 mln
-8.229 mln
-4.68%
jan 1, 1992
168.042 mln
+552.113K
0.33%
jan 1, 1993
140.708 mln
-27.334 mln
-16.27%
jan 1, 1994
114.096 mln
-26.611 mln
-18.91%
jan 1, 1995
109.073 mln
-5.023 mln
-4.4%
jan 1, 1996
163.167 mln
+54.094 mln
49.59%
jan 1, 1997
175.06 mln
+11.893 mln
7.29%
jan 1, 1998
132.825 mln
-42.235 mln
-24.13%
jan 1, 1999
179.02 mln
+46.195 mln
34.78%
jan 1, 2000
139.098 mln
-39.922 mln
-22.3%
jan 1, 2001
139.821 mln
+723.821K
0.52%
jan 1, 2002
366.566 mln
+226.745 mln
162.17%
jan 1, 2003
460.808 mln
+94.242 mln
25.71%
jan 1, 2004
348.96 mln
-111.848 mln
-24.27%
jan 1, 2005
399.357 mln
+50.397 mln
14.44%
jan 1, 2006
476.988 mln
+77.632 mln
19.44%
jan 1, 2007
537.896 mln
+60.908 mln
12.77%
jan 1, 2008
712.979 mln
+175.083 mln
32.55%
jan 1, 2009
954.564 mln
+241.585 mln
33.88%
jan 1, 2010
1.055 bln
+100.296 mln
10.51%
jan 1, 2011
1.221 bln
+165.71 mln
15.71%
jan 1, 2012
935.371 mln
-285.198 mln
-23.37%
jan 1, 2013
837.862 mln
-97.51 mln
-10.42%
jan 1, 2014
2.845 bln
+2.008 bln
239.6%
jan 1, 2015
3.117 bln
+271.619 mln
9.55%
Ranking of countries by current statistics by years


Comments: