29
/
en
AIzaSyAYiBZKx7MnpbEhh9jyipgxe19OcubqV5w
April 1, 2024
250073
St. Kitts and Nevis
KNA
true
2
1
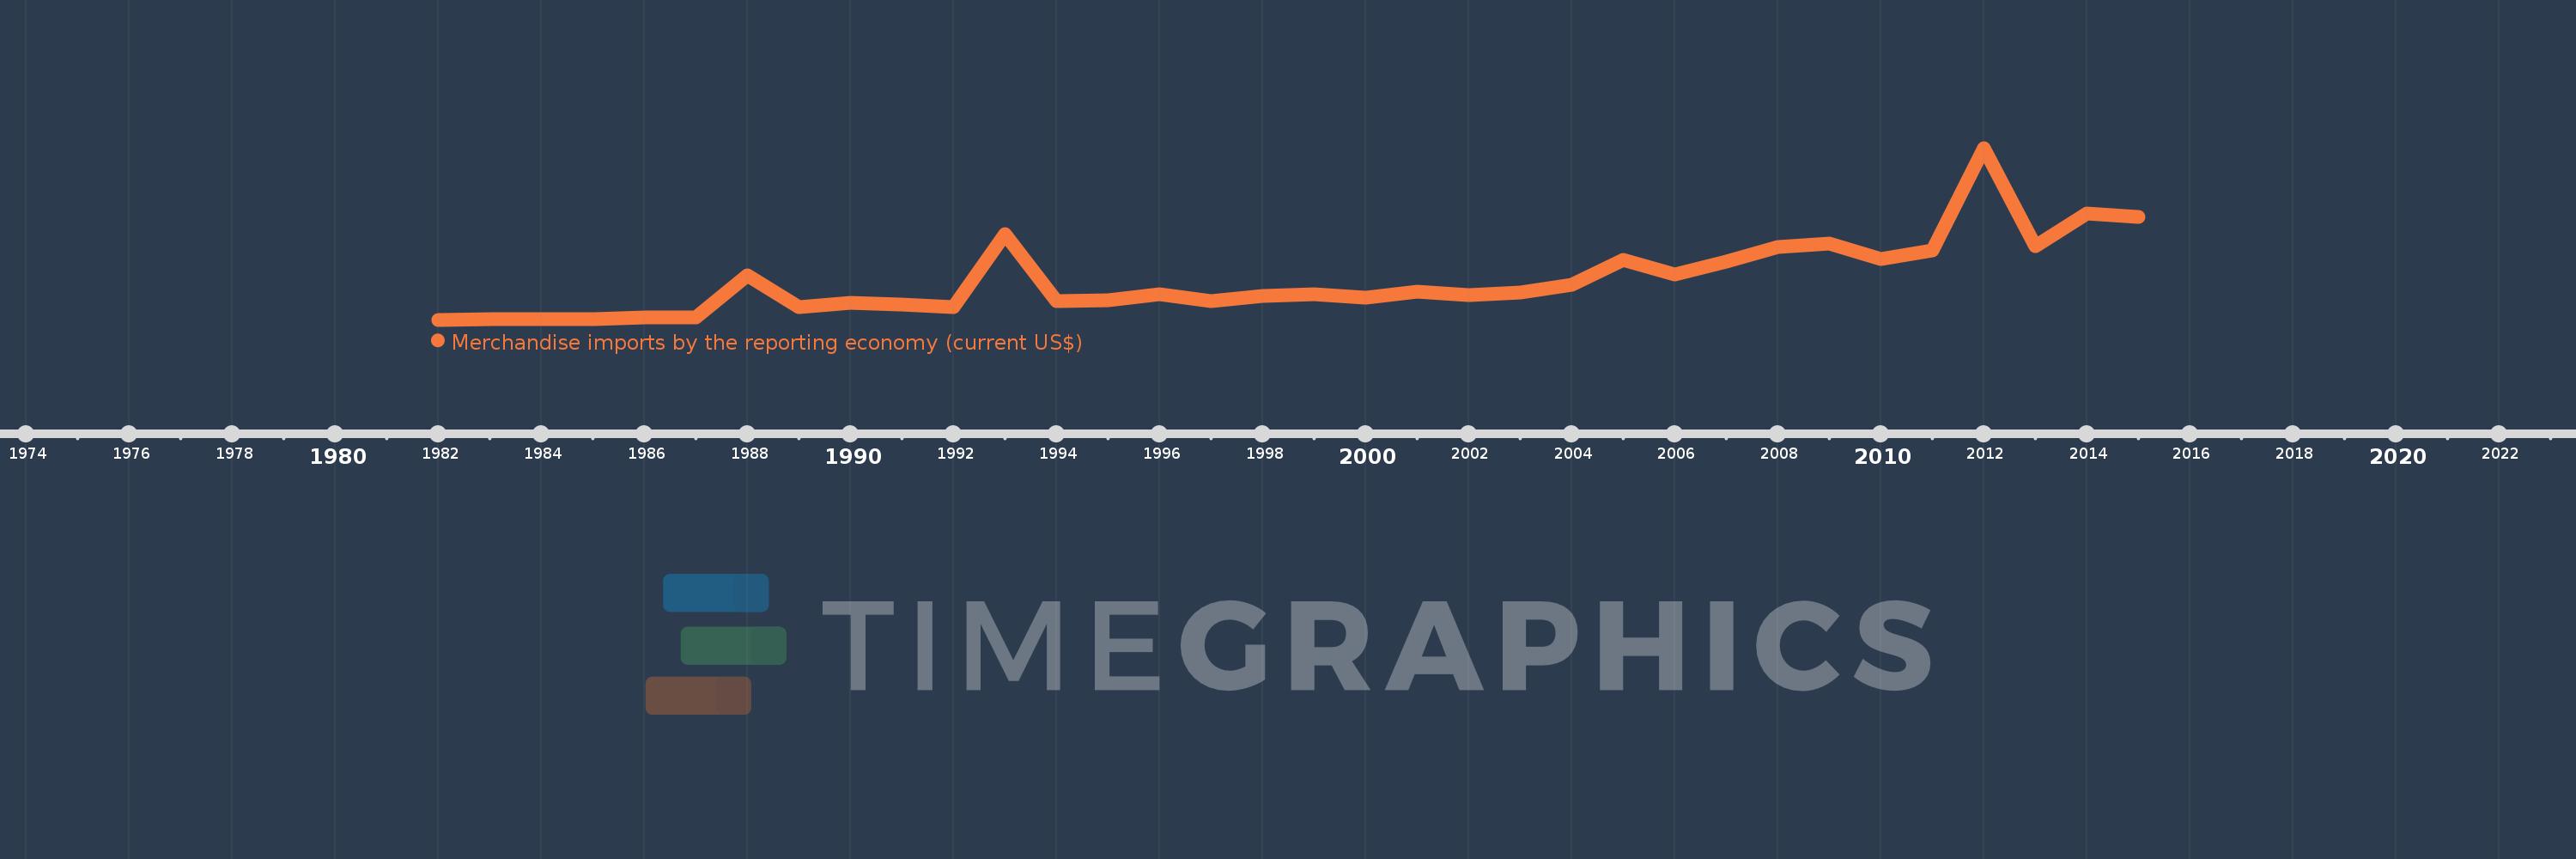
Merchandise imports by the reporting economy (current US$)
2015,2014,2013,2012,2011,2010,2009,2008,2007,2006,2005,2004,2003,2002,2001,2000,1999,1998,1997,1996,1995,1994,1993,1992,1991,1990,1989,1988,1987,1986,1985,1984,1983,1982
This statistics in other country:
AfghanistanAlbaniaAlgeriaAmerican SamoaAngolaAntigua and BarbudaArab WorldArgentinaArmeniaArubaAustraliaAustriaAzerbaijanBahamas, TheBahrainBangladeshBarbadosBelarusBelgiumBelizeBeninBermudaBoliviaBosnia and HerzegovinaBrazilBrunei DarussalamBulgariaBurkina FasoBurundiCabo VerdeCambodiaCameroonCanadaCaribbean small statesCentral African RepublicCentral Europe and the BalticsChadChileChinaColombiaComorosCongo, Dem. Rep.Congo, Rep.Costa RicaCote d'IvoireCroatiaCubaCyprusCzech RepublicDenmarkDjiboutiDominicaDominican RepublicEarly-demographic dividendEast Asia & PacificEast Asia & Pacific (excluding high income)East Asia & Pacific (IDA & IBRD countries)EcuadorEgypt, Arab Rep.El SalvadorEquatorial GuineaEstoniaEthiopiaEuro areaEurope & Central AsiaEurope & Central Asia (excluding high income)Europe & Central Asia (IDA & IBRD countries)European UnionFaroe IslandsFijiFinlandFragile and conflict affected situationsFranceFrench PolynesiaGabonGambia, TheGeorgiaGermanyGhanaGibraltarGreeceGreenlandGrenadaGuamGuatemalaGuineaGuinea-BissauGuyanaHaitiHeavily indebted poor countries (HIPC)High incomeHondurasHong Kong SAR, ChinaHungaryIBRD onlyIcelandIDA & IBRD totalIDA blendIDA onlyIDA totalIndiaIndonesiaIran, Islamic Rep.IraqIrelandIsraelItalyJamaicaJapanJordanKazakhstanKenyaKiribatiKorea, Dem. People’s Rep.Korea, Rep.KosovoKuwaitKyrgyz RepublicLao PDRLate-demographic dividendLatin America & Caribbean Latin America & Caribbean (excluding high income)Latin America & the Caribbean (IDA & IBRD countries)LatviaLeast developed countries: UN classificationLebanonLiberiaLibyaLithuaniaLow & middle incomeLow incomeLower middle incomeLuxembourgMacao SAR, ChinaMacedonia, FYRMadagascarMalawiMalaysiaMaldivesMaliMaltaMauritaniaMauritiusMexicoMiddle East & North AfricaMiddle East & North Africa (excluding high income)Middle East & North Africa (IDA & IBRD countries)Middle incomeMoldovaMongoliaMontenegroMoroccoMozambiqueMyanmarNauruNepalNetherlandsNew CaledoniaNew ZealandNicaraguaNigerNigeriaNorth AmericaNorwayOECD membersOmanOther small statesPacific island small statesPakistanPanamaPapua New GuineaParaguayPeruPhilippinesPolandPortugalPost-demographic dividendPre-demographic dividendQatarRomaniaRussian FederationRwandaSamoaSao Tome and PrincipeSaudi ArabiaSenegalSerbiaSeychellesSierra LeoneSingaporeSlovak RepublicSloveniaSmall statesSolomon IslandsSomaliaSouth AfricaSouth AsiaSouth Asia (IDA & IBRD)SpainSri LankaSt. Kitts and NevisSt. LuciaSt. Vincent and the GrenadinesSub-Saharan Africa Sub-Saharan Africa (excluding high income)Sub-Saharan Africa (IDA & IBRD countries)SudanSurinameSwedenSwitzerlandSyrian Arab RepublicTajikistanTanzaniaThailandTogoTongaTrinidad and TobagoTunisiaTurkeyTurkmenistanTuvaluUgandaUkraineUnited Arab EmiratesUnited KingdomUnited StatesUpper middle incomeUruguayUzbekistanVanuatuVenezuela, RBVietnamWorldYemen, Rep.ZambiaZimbabwe Timeline:
This timeline shows a graph from 1982 to 2015 of St. Kitts and Nevis. No data until 1981. Number of actual observations by date: 34.
Source name:
World Development Indicators
Source organization:
World Bank staff estimates based data from International Monetary Fund's Direction of Trade database.
Categories, topics:
Private Sector, Trade
Last updated:
apr 23, 2017
Indicators value changes by year
Minimum:
8.348 mln
jan 1, 1982
Maximum:
1.14 bln
jan 1, 2012
At the date of observation
Value
Absolute change
Change from previous value
jan 1, 1982
8.348 mln
+8.348 mln
0.0%
jan 1, 1983
10.228 mln
+1.88 mln
22.52%
jan 1, 1984
10.254 mln
+26.4K
0.26%
jan 1, 1985
12.801 mln
+2.547 mln
24.84%
jan 1, 1986
24.718 mln
+11.917 mln
93.1%
jan 1, 1987
23.646 mln
-1.073 mln
-4.34%
jan 1, 1988
299.573 mln
+275.928 mln
1.17K%
jan 1, 1989
89.153 mln
-210.42 mln
-70.24%
jan 1, 1990
119.343 mln
+30.19 mln
33.86%
jan 1, 1991
108.425 mln
-10.918 mln
-9.15%
jan 1, 1992
93.093 mln
-15.333 mln
-14.14%
jan 1, 1993
574.293 mln
+481.2 mln
516.9%
jan 1, 1994
128.751 mln
-445.542 mln
-77.58%
jan 1, 1995
136.795 mln
+8.044 mln
6.25%
jan 1, 1996
176.116 mln
+39.321 mln
28.74%
jan 1, 1997
132.631 mln
-43.485 mln
-24.69%
jan 1, 1998
167.672 mln
+35.041 mln
26.42%
jan 1, 1999
176.872 mln
+9.2 mln
5.49%
jan 1, 2000
153.537 mln
-23.335 mln
-13.19%
jan 1, 2001
195.976 mln
+42.439 mln
27.64%
jan 1, 2002
168.339 mln
-27.637 mln
-14.1%
jan 1, 2003
187.445 mln
+19.106 mln
11.35%
jan 1, 2004
240.153 mln
+52.708 mln
28.12%
jan 1, 2005
403.723 mln
+163.57 mln
68.11%
jan 1, 2006
308.47 mln
-95.253 mln
-23.59%
jan 1, 2007
391.549 mln
+83.079 mln
26.93%
jan 1, 2008
487.611 mln
+96.061 mln
24.53%
jan 1, 2009
512.273 mln
+24.662 mln
5.06%
jan 1, 2010
408.987 mln
-103.285 mln
-20.16%
jan 1, 2011
465.574 mln
+56.586 mln
13.84%
jan 1, 2012
1.14 bln
+674.201 mln
144.81%
jan 1, 2013
490.374 mln
-649.401 mln
-56.98%
jan 1, 2014
710.089 mln
+219.715 mln
44.81%
jan 1, 2015
683.013 mln
-27.076 mln
-3.81%
Ranking of countries by current statistics by years


Comments: