29
/
en
AIzaSyAYiBZKx7MnpbEhh9jyipgxe19OcubqV5w
April 1, 2024
26726
Early-demographic dividend
EAR
false
2
1
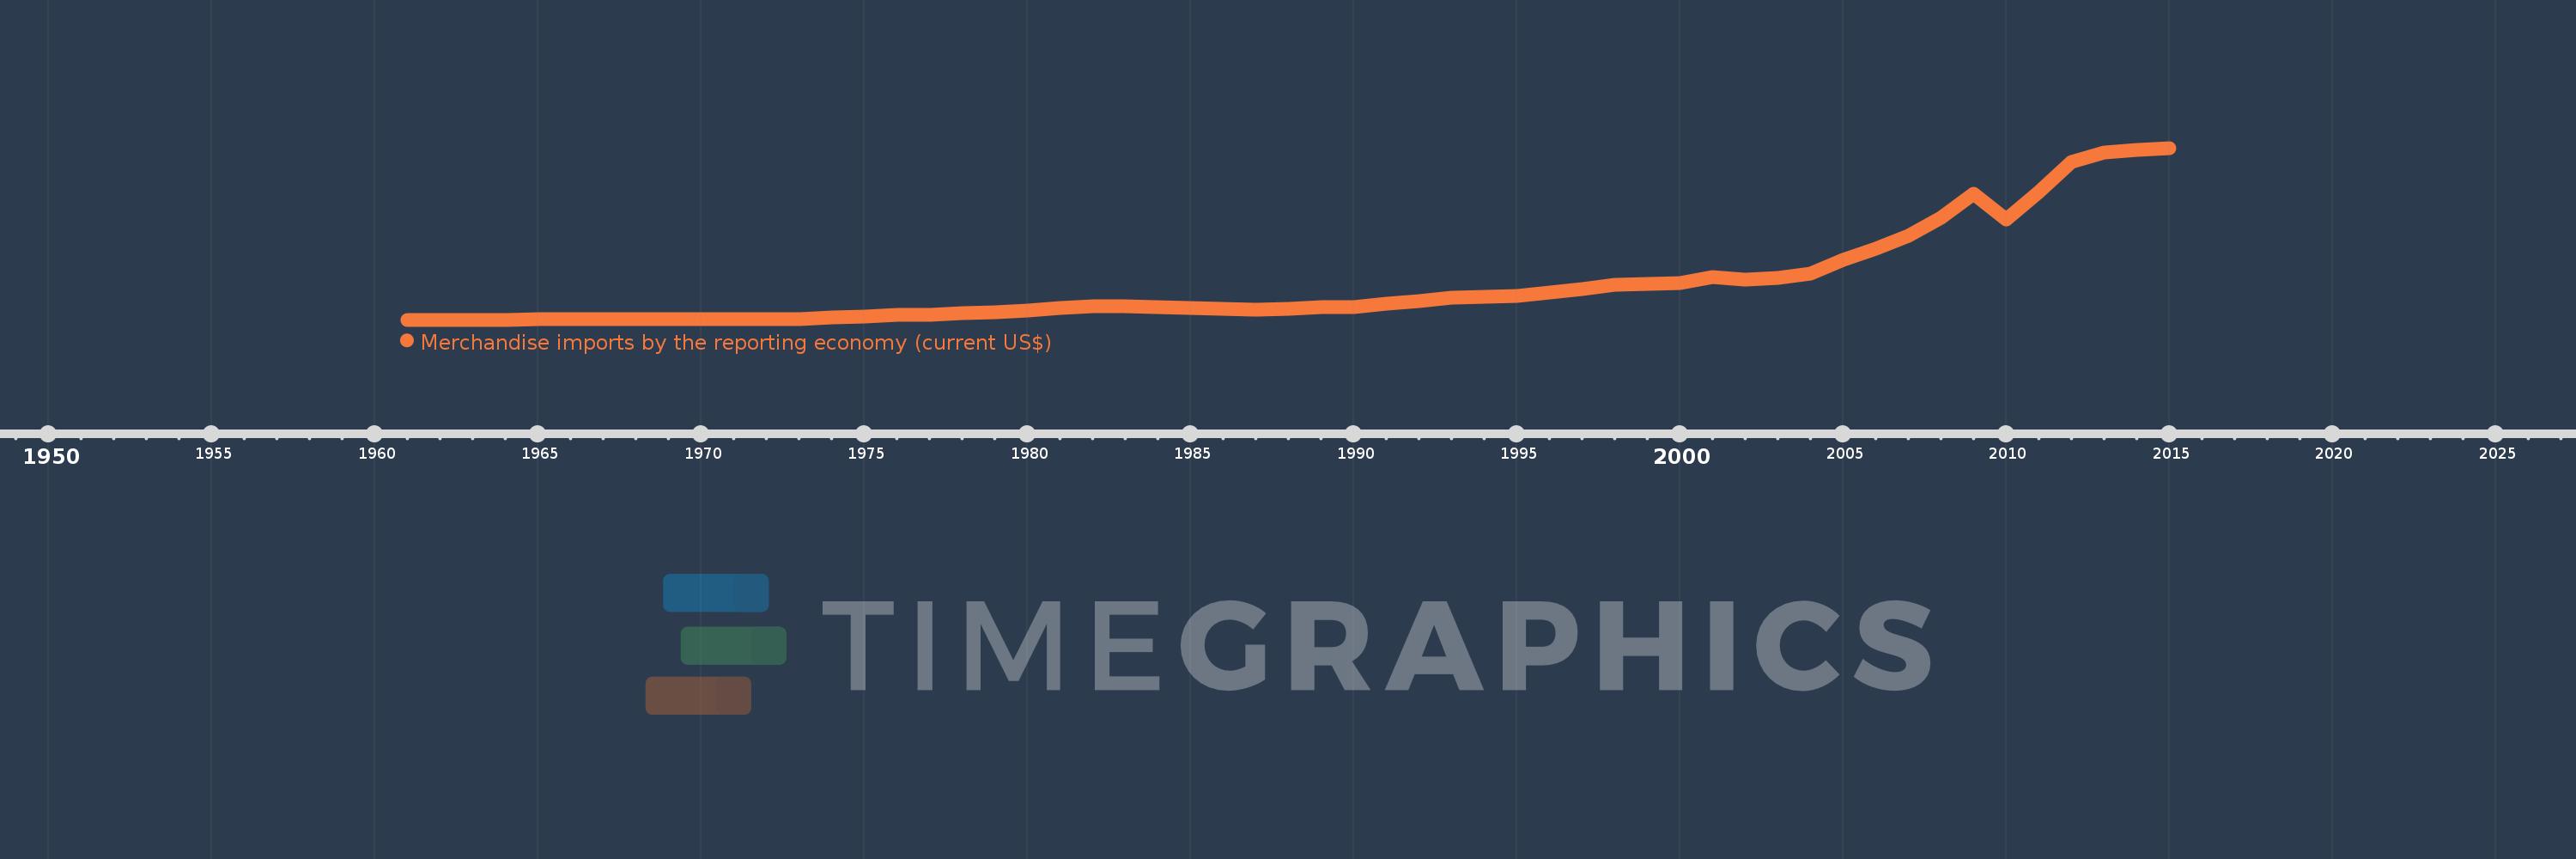
Merchandise imports by the reporting economy (current US$)
2015,2014,2013,2012,2011,2010,2009,2008,2007,2006,2005,2004,2003,2002,2001,2000,1999,1998,1997,1996,1995,1994,1993,1992,1991,1990,1989,1988,1987,1986,1985,1984,1983,1982,1981,1980,1979,1978,1977,1976,1975,1974,1973,1972,1971,1970,1969,1968,1967,1966,1965,1964,1963,1962,1961
This statistics in other country:
AfghanistanAlbaniaAlgeriaAmerican SamoaAngolaAntigua and BarbudaArab WorldArgentinaArmeniaArubaAustraliaAustriaAzerbaijanBahamas, TheBahrainBangladeshBarbadosBelarusBelgiumBelizeBeninBermudaBoliviaBosnia and HerzegovinaBrazilBrunei DarussalamBulgariaBurkina FasoBurundiCabo VerdeCambodiaCameroonCanadaCaribbean small statesCentral African RepublicCentral Europe and the BalticsChadChileChinaColombiaComorosCongo, Dem. Rep.Congo, Rep.Costa RicaCote d'IvoireCroatiaCubaCyprusCzech RepublicDenmarkDjiboutiDominicaDominican RepublicEarly-demographic dividendEast Asia & PacificEast Asia & Pacific (excluding high income)East Asia & Pacific (IDA & IBRD countries)EcuadorEgypt, Arab Rep.El SalvadorEquatorial GuineaEstoniaEthiopiaEuro areaEurope & Central AsiaEurope & Central Asia (excluding high income)Europe & Central Asia (IDA & IBRD countries)European UnionFaroe IslandsFijiFinlandFragile and conflict affected situationsFranceFrench PolynesiaGabonGambia, TheGeorgiaGermanyGhanaGibraltarGreeceGreenlandGrenadaGuamGuatemalaGuineaGuinea-BissauGuyanaHaitiHeavily indebted poor countries (HIPC)High incomeHondurasHong Kong SAR, ChinaHungaryIBRD onlyIcelandIDA & IBRD totalIDA blendIDA onlyIDA totalIndiaIndonesiaIran, Islamic Rep.IraqIrelandIsraelItalyJamaicaJapanJordanKazakhstanKenyaKiribatiKorea, Dem. People’s Rep.Korea, Rep.KosovoKuwaitKyrgyz RepublicLao PDRLate-demographic dividendLatin America & Caribbean Latin America & Caribbean (excluding high income)Latin America & the Caribbean (IDA & IBRD countries)LatviaLeast developed countries: UN classificationLebanonLiberiaLibyaLithuaniaLow & middle incomeLow incomeLower middle incomeLuxembourgMacao SAR, ChinaMacedonia, FYRMadagascarMalawiMalaysiaMaldivesMaliMaltaMauritaniaMauritiusMexicoMiddle East & North AfricaMiddle East & North Africa (excluding high income)Middle East & North Africa (IDA & IBRD countries)Middle incomeMoldovaMongoliaMontenegroMoroccoMozambiqueMyanmarNauruNepalNetherlandsNew CaledoniaNew ZealandNicaraguaNigerNigeriaNorth AmericaNorwayOECD membersOmanOther small statesPacific island small statesPakistanPanamaPapua New GuineaParaguayPeruPhilippinesPolandPortugalPost-demographic dividendPre-demographic dividendQatarRomaniaRussian FederationRwandaSamoaSao Tome and PrincipeSaudi ArabiaSenegalSerbiaSeychellesSierra LeoneSingaporeSlovak RepublicSloveniaSmall statesSolomon IslandsSomaliaSouth AfricaSouth AsiaSouth Asia (IDA & IBRD)SpainSri LankaSt. Kitts and NevisSt. LuciaSt. Vincent and the GrenadinesSub-Saharan Africa Sub-Saharan Africa (excluding high income)Sub-Saharan Africa (IDA & IBRD countries)SudanSurinameSwedenSwitzerlandSyrian Arab RepublicTajikistanTanzaniaThailandTogoTongaTrinidad and TobagoTunisiaTurkeyTurkmenistanTuvaluUgandaUkraineUnited Arab EmiratesUnited KingdomUnited StatesUpper middle incomeUruguayUzbekistanVanuatuVenezuela, RBVietnamWorldYemen, Rep.ZambiaZimbabwe Timeline:
This timeline shows a graph from 1961 to 2015 of Early-demographic dividend. No data until 1960. Number of actual observations by date: 55.
Source name:
World Development Indicators
Source organization:
World Bank staff estimates based data from International Monetary Fund's Direction of Trade database.
Categories, topics:
Private Sector, Trade
Last updated:
apr 23, 2017
Indicators value changes by year
Minimum:
13.273 bln
jan 1, 1963
Maximum:
2.62 trl
jan 1, 2015
At the date of observation
Value
Absolute change
Change from previous value
jan 1, 1961
13.859 bln
+13.859 bln
0.0%
jan 1, 1962
14.044 bln
+184.86 mln
1.33%
jan 1, 1963
13.273 bln
-771.214 mln
-5.49%
jan 1, 1964
13.777 bln
+504.159 mln
3.8%
jan 1, 1965
16.791 bln
+3.014 bln
21.88%
jan 1, 1966
17.556 bln
+765.476 mln
4.56%
jan 1, 1967
18.253 bln
+696.494 mln
3.97%
jan 1, 1968
18.892 bln
+639.376 mln
3.5%
jan 1, 1969
20.389 bln
+1.497 bln
7.92%
jan 1, 1970
21.498 bln
+1.109 bln
5.44%
jan 1, 1971
22.077 bln
+579.168 mln
2.69%
jan 1, 1972
23.936 bln
+1.859 bln
8.42%
jan 1, 1973
26.466 bln
+2.53 bln
10.57%
jan 1, 1974
42.117 bln
+15.651 bln
59.14%
jan 1, 1975
67.278 bln
+25.161 bln
59.74%
jan 1, 1976
87.295 bln
+20.017 bln
29.75%
jan 1, 1977
93.498 bln
+6.203 bln
7.11%
jan 1, 1978
115.286 bln
+21.789 bln
23.3%
jan 1, 1979
129.27 bln
+13.984 bln
12.13%
jan 1, 1980
146.727 bln
+17.457 bln
13.5%
jan 1, 1981
194.515 bln
+47.788 bln
32.57%
jan 1, 1982
224.061 bln
+29.546 bln
15.19%
jan 1, 1983
212.689 bln
-11.372 bln
-5.08%
jan 1, 1984
199.481 bln
-13.208 bln
-6.21%
jan 1, 1985
193.139 bln
-6.342 bln
-3.18%
jan 1, 1986
173.001 bln
-20.139 bln
-10.43%
jan 1, 1987
162.739 bln
-10.262 bln
-5.93%
jan 1, 1988
182.171 bln
+19.432 bln
11.94%
jan 1, 1989
200.008 bln
+17.837 bln
9.79%
jan 1, 1990
209.766 bln
+9.758 bln
4.88%
jan 1, 1991
256.96 bln
+47.194 bln
22.5%
jan 1, 1992
300.382 bln
+43.422 bln
16.9%
jan 1, 1993
351.095 bln
+50.713 bln
16.88%
jan 1, 1994
354.914 bln
+3.819 bln
1.09%
jan 1, 1995
378.181 bln
+23.267 bln
6.56%
jan 1, 1996
432.957 bln
+54.775 bln
14.48%
jan 1, 1997
484.534 bln
+51.578 bln
11.91%
jan 1, 1998
538.102 bln
+53.567 bln
11.06%
jan 1, 1999
562.939 bln
+24.837 bln
4.62%
jan 1, 2000
565.084 bln
+2.145 bln
0.38%
jan 1, 2001
661.855 bln
+96.771 bln
17.13%
jan 1, 2002
624.501 bln
-37.353 bln
-5.64%
jan 1, 2003
641.688 bln
+17.186 bln
2.75%
jan 1, 2004
712.52 bln
+70.832 bln
11.04%
jan 1, 2005
915.618 bln
+203.098 bln
28.5%
jan 1, 2006
1.092 trl
+176.051 bln
19.23%
jan 1, 2007
1.283 trl
+191.774 bln
17.57%
jan 1, 2008
1.558 trl
+274.249 bln
21.37%
jan 1, 2009
1.919 trl
+361.629 bln
23.22%
jan 1, 2010
1.536 trl
-383.229 bln
-19.97%
jan 1, 2011
1.952 trl
+416.17 bln
27.09%
jan 1, 2012
2.413 trl
+460.567 bln
23.59%
jan 1, 2013
2.554 trl
+140.944 bln
5.84%
jan 1, 2014
2.594 trl
+39.848 bln
1.56%
jan 1, 2015
2.62 trl
+26.652 bln
1.03%
Ranking of countries by current statistics by years


Comments: