29
/
en
AIzaSyAYiBZKx7MnpbEhh9jyipgxe19OcubqV5w
April 1, 2024
73226
Australia
AUS
true
2
1
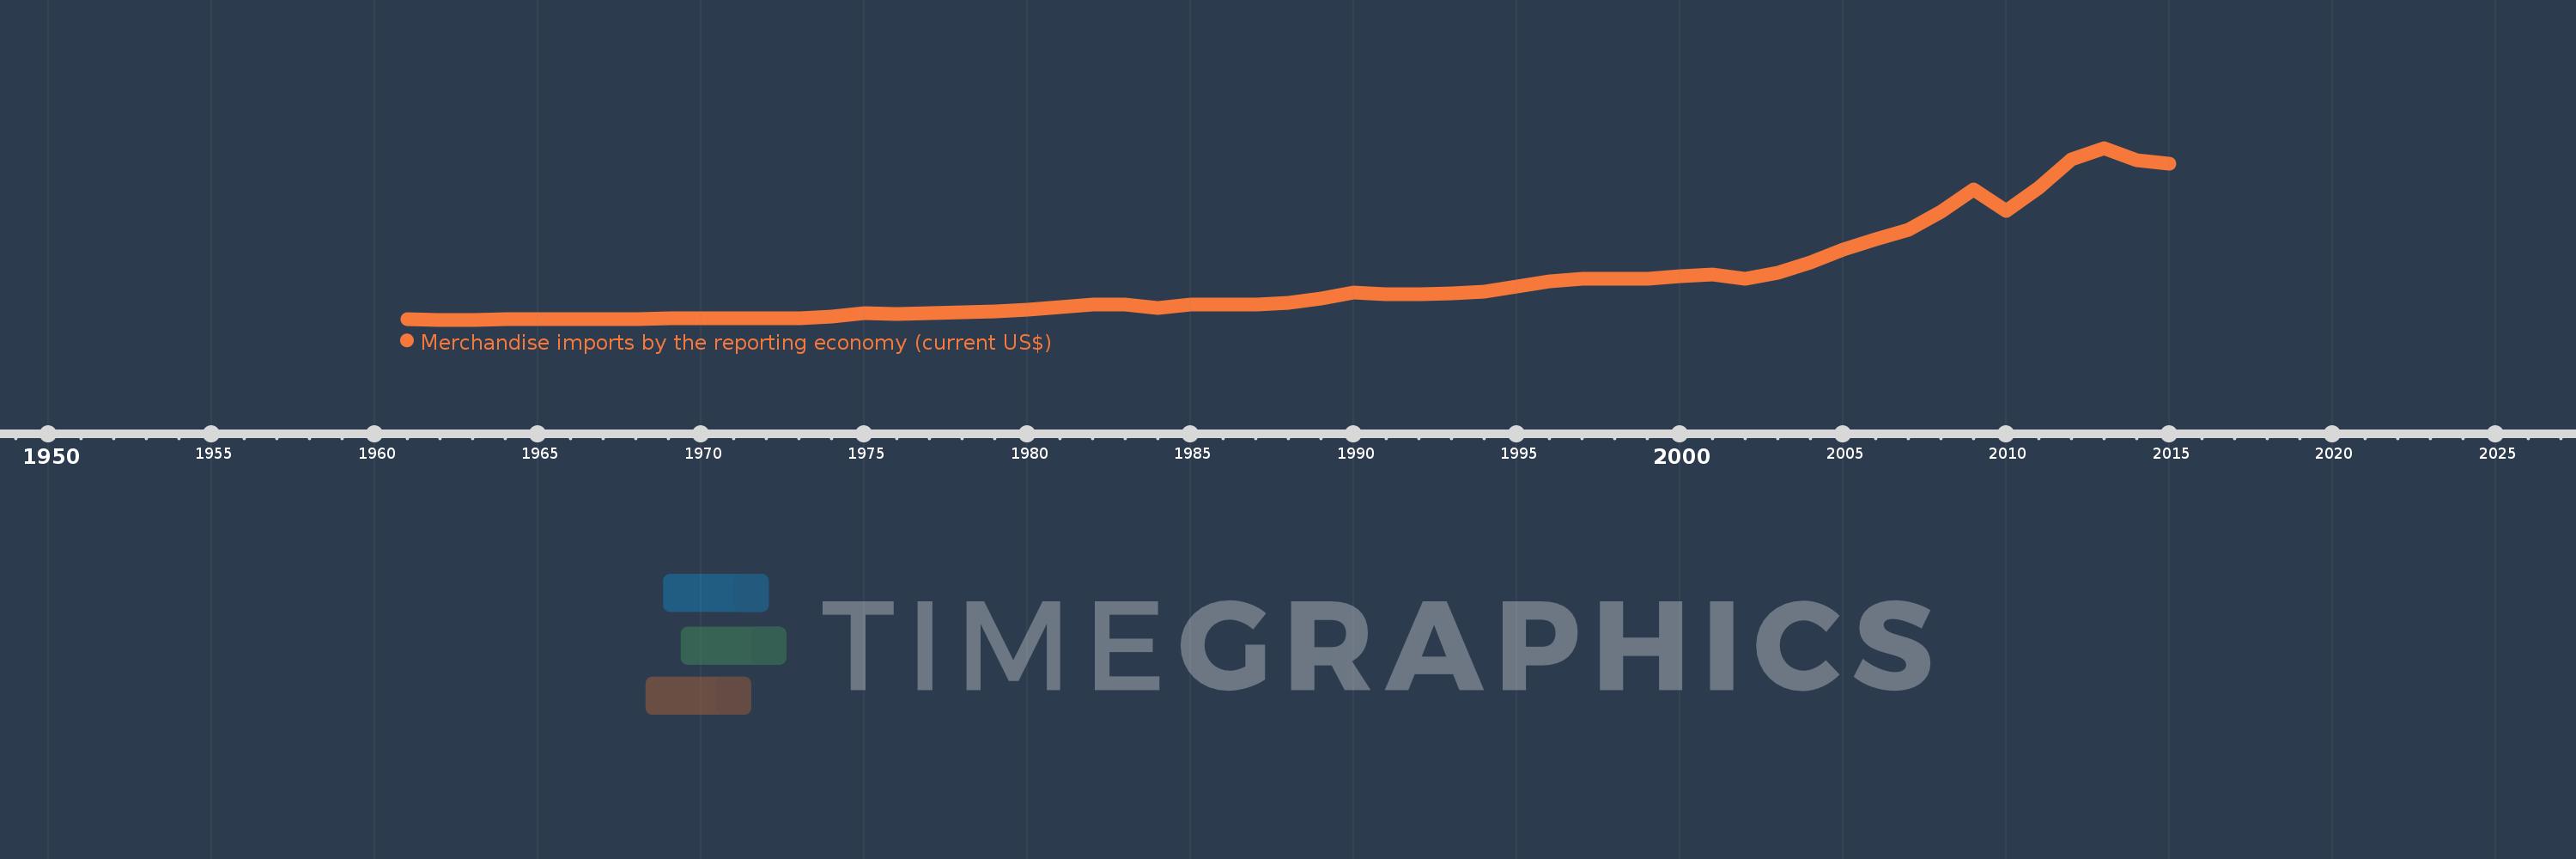
Merchandise imports by the reporting economy (current US$)
2015,2014,2013,2012,2011,2010,2009,2008,2007,2006,2005,2004,2003,2002,2001,2000,1999,1998,1997,1996,1995,1994,1993,1992,1991,1990,1989,1988,1987,1986,1985,1984,1983,1982,1981,1980,1979,1978,1977,1976,1975,1974,1973,1972,1971,1970,1969,1968,1967,1966,1965,1964,1963,1962,1961
This statistics in other country:
AfghanistanAlbaniaAlgeriaAmerican SamoaAngolaAntigua and BarbudaArab WorldArgentinaArmeniaArubaAustraliaAustriaAzerbaijanBahamas, TheBahrainBangladeshBarbadosBelarusBelgiumBelizeBeninBermudaBoliviaBosnia and HerzegovinaBrazilBrunei DarussalamBulgariaBurkina FasoBurundiCabo VerdeCambodiaCameroonCanadaCaribbean small statesCentral African RepublicCentral Europe and the BalticsChadChileChinaColombiaComorosCongo, Dem. Rep.Congo, Rep.Costa RicaCote d'IvoireCroatiaCubaCyprusCzech RepublicDenmarkDjiboutiDominicaDominican RepublicEarly-demographic dividendEast Asia & PacificEast Asia & Pacific (excluding high income)East Asia & Pacific (IDA & IBRD countries)EcuadorEgypt, Arab Rep.El SalvadorEquatorial GuineaEstoniaEthiopiaEuro areaEurope & Central AsiaEurope & Central Asia (excluding high income)Europe & Central Asia (IDA & IBRD countries)European UnionFaroe IslandsFijiFinlandFragile and conflict affected situationsFranceFrench PolynesiaGabonGambia, TheGeorgiaGermanyGhanaGibraltarGreeceGreenlandGrenadaGuamGuatemalaGuineaGuinea-BissauGuyanaHaitiHeavily indebted poor countries (HIPC)High incomeHondurasHong Kong SAR, ChinaHungaryIBRD onlyIcelandIDA & IBRD totalIDA blendIDA onlyIDA totalIndiaIndonesiaIran, Islamic Rep.IraqIrelandIsraelItalyJamaicaJapanJordanKazakhstanKenyaKiribatiKorea, Dem. People’s Rep.Korea, Rep.KosovoKuwaitKyrgyz RepublicLao PDRLate-demographic dividendLatin America & Caribbean Latin America & Caribbean (excluding high income)Latin America & the Caribbean (IDA & IBRD countries)LatviaLeast developed countries: UN classificationLebanonLiberiaLibyaLithuaniaLow & middle incomeLow incomeLower middle incomeLuxembourgMacao SAR, ChinaMacedonia, FYRMadagascarMalawiMalaysiaMaldivesMaliMaltaMauritaniaMauritiusMexicoMiddle East & North AfricaMiddle East & North Africa (excluding high income)Middle East & North Africa (IDA & IBRD countries)Middle incomeMoldovaMongoliaMontenegroMoroccoMozambiqueMyanmarNauruNepalNetherlandsNew CaledoniaNew ZealandNicaraguaNigerNigeriaNorth AmericaNorwayOECD membersOmanOther small statesPacific island small statesPakistanPanamaPapua New GuineaParaguayPeruPhilippinesPolandPortugalPost-demographic dividendPre-demographic dividendQatarRomaniaRussian FederationRwandaSamoaSao Tome and PrincipeSaudi ArabiaSenegalSerbiaSeychellesSierra LeoneSingaporeSlovak RepublicSloveniaSmall statesSolomon IslandsSomaliaSouth AfricaSouth AsiaSouth Asia (IDA & IBRD)SpainSri LankaSt. Kitts and NevisSt. LuciaSt. Vincent and the GrenadinesSub-Saharan Africa Sub-Saharan Africa (excluding high income)Sub-Saharan Africa (IDA & IBRD countries)SudanSurinameSwedenSwitzerlandSyrian Arab RepublicTajikistanTanzaniaThailandTogoTongaTrinidad and TobagoTunisiaTurkeyTurkmenistanTuvaluUgandaUkraineUnited Arab EmiratesUnited KingdomUnited StatesUpper middle incomeUruguayUzbekistanVanuatuVenezuela, RBVietnamWorldYemen, Rep.ZambiaZimbabwe Timeline:
This timeline shows a graph from 1961 to 2015 of Australia. No data until 1960. Number of actual observations by date: 55.
Source name:
World Development Indicators
Source organization:
World Bank staff estimates based data from International Monetary Fund's Direction of Trade database.
Categories, topics:
Private Sector, Trade
Last updated:
apr 23, 2017
Indicators value changes by year
Minimum:
2.249 bln
jan 1, 1962
Maximum:
275.779 bln
jan 1, 2013
At the date of observation
Value
Absolute change
Change from previous value
jan 1, 1961
2.524 bln
+2.524 bln
0.0%
jan 1, 1962
2.249 bln
-275.0 mln
-10.9%
jan 1, 1963
2.438 bln
+189.31 mln
8.42%
jan 1, 1964
2.681 bln
+242.99 mln
9.97%
jan 1, 1965
3.21 bln
+528.77 mln
19.72%
jan 1, 1966
3.649 bln
+439.12 mln
13.68%
jan 1, 1967
3.565 bln
-84.15 mln
-2.31%
jan 1, 1968
3.855 bln
+290.18 mln
8.14%
jan 1, 1969
4.303 bln
+447.26 mln
11.6%
jan 1, 1970
4.463 bln
+160.94 mln
3.74%
jan 1, 1971
4.994 bln
+530.1 mln
11.88%
jan 1, 1972
5.144 bln
+150.36 mln
3.01%
jan 1, 1973
5.057 bln
-87.39 mln
-1.7%
jan 1, 1974
7.576 bln
+2.519 bln
49.82%
jan 1, 1975
12.317 bln
+4.741 bln
62.59%
jan 1, 1976
11.019 bln
-1.298 bln
-10.54%
jan 1, 1977
12.3 bln
+1.281 bln
11.62%
jan 1, 1978
13.499 bln
+1.199 bln
9.75%
jan 1, 1979
15.553 bln
+2.054 bln
15.22%
jan 1, 1980
18.297 bln
+2.744 bln
17.64%
jan 1, 1981
22.4 bln
+4.103 bln
22.43%
jan 1, 1982
26.176 bln
+3.776 bln
16.86%
jan 1, 1983
26.52 bln
+344.21 mln
1.32%
jan 1, 1984
21.383 bln
-5.137 bln
-19.37%
jan 1, 1985
25.784 bln
+4.401 bln
20.58%
jan 1, 1986
25.865 bln
+81.11 mln
0.31%
jan 1, 1987
26.237 bln
+371.78 mln
1.44%
jan 1, 1988
29.718 bln
+3.481 bln
13.27%
jan 1, 1989
36.671 bln
+6.953 bln
23.4%
jan 1, 1990
45.035 bln
+8.364 bln
22.81%
jan 1, 1991
43.052 bln
-1.983 bln
-4.4%
jan 1, 1992
42.63 bln
-421.254 mln
-0.98%
jan 1, 1993
44.816 bln
+2.186 bln
5.13%
jan 1, 1994
46.721 bln
+1.905 bln
4.25%
jan 1, 1995
55.09 bln
+8.369 bln
17.91%
jan 1, 1996
63.23 bln
+8.14 bln
14.78%
jan 1, 1997
67.716 bln
+4.487 bln
7.1%
jan 1, 1998
67.974 bln
+258.026 mln
0.38%
jan 1, 1999
66.852 bln
-1.123 bln
-1.65%
jan 1, 2000
71.932 bln
+5.08 bln
7.6%
jan 1, 2001
74.275 bln
+2.343 bln
3.26%
jan 1, 2002
66.857 bln
-7.418 bln
-9.99%
jan 1, 2003
76.514 bln
+9.657 bln
14.44%
jan 1, 2004
93.208 bln
+16.695 bln
21.82%
jan 1, 2005
114.097 bln
+20.889 bln
22.41%
jan 1, 2006
130.949 bln
+16.852 bln
14.77%
jan 1, 2007
146.126 bln
+15.176 bln
11.59%
jan 1, 2008
173.546 bln
+27.42 bln
18.76%
jan 1, 2009
210.134 bln
+36.588 bln
21.08%
jan 1, 2010
174.961 bln
-35.173 bln
-16.74%
jan 1, 2011
212.476 bln
+37.515 bln
21.44%
jan 1, 2012
257.976 bln
+45.5 bln
21.41%
jan 1, 2013
275.779 bln
+17.803 bln
6.9%
jan 1, 2014
256.062 bln
-19.717 bln
-7.15%
jan 1, 2015
250.538 bln
-5.524 bln
-2.16%
Ranking of countries by current statistics by years


Comments: