29
/
en
AIzaSyAYiBZKx7MnpbEhh9jyipgxe19OcubqV5w
April 1, 2024
125086
Egypt, Arab Rep.
EGY
true
2
1
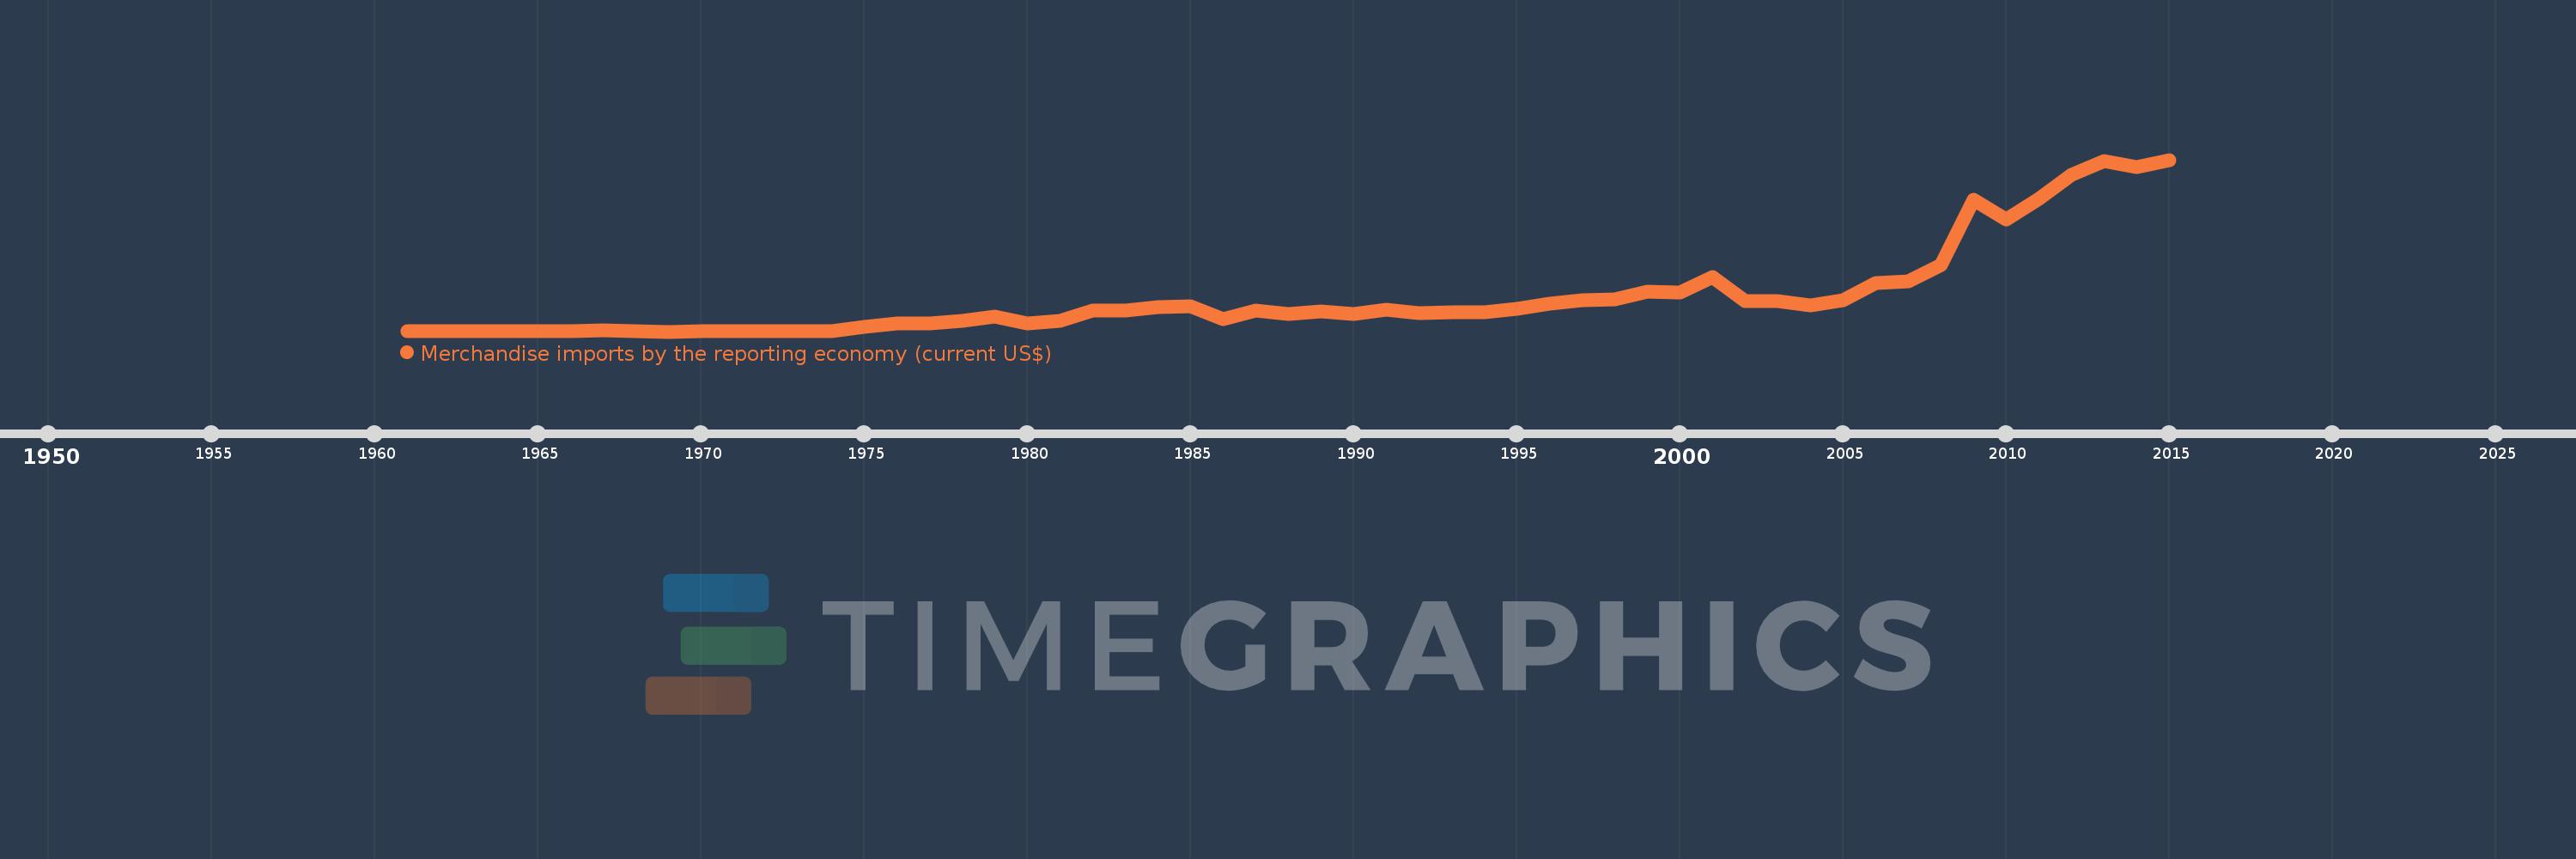
Merchandise imports by the reporting economy (current US$)
2015,2014,2013,2012,2011,2010,2009,2008,2007,2006,2005,2004,2003,2002,2001,2000,1999,1998,1997,1996,1995,1994,1993,1992,1991,1990,1989,1988,1987,1986,1985,1984,1983,1982,1981,1980,1979,1978,1977,1976,1975,1974,1973,1972,1971,1970,1969,1968,1967,1966,1965,1964,1963,1962,1961
This statistics in other country:
AfghanistanAlbaniaAlgeriaAmerican SamoaAngolaAntigua and BarbudaArab WorldArgentinaArmeniaArubaAustraliaAustriaAzerbaijanBahamas, TheBahrainBangladeshBarbadosBelarusBelgiumBelizeBeninBermudaBoliviaBosnia and HerzegovinaBrazilBrunei DarussalamBulgariaBurkina FasoBurundiCabo VerdeCambodiaCameroonCanadaCaribbean small statesCentral African RepublicCentral Europe and the BalticsChadChileChinaColombiaComorosCongo, Dem. Rep.Congo, Rep.Costa RicaCote d'IvoireCroatiaCubaCyprusCzech RepublicDenmarkDjiboutiDominicaDominican RepublicEarly-demographic dividendEast Asia & PacificEast Asia & Pacific (excluding high income)East Asia & Pacific (IDA & IBRD countries)EcuadorEgypt, Arab Rep.El SalvadorEquatorial GuineaEstoniaEthiopiaEuro areaEurope & Central AsiaEurope & Central Asia (excluding high income)Europe & Central Asia (IDA & IBRD countries)European UnionFaroe IslandsFijiFinlandFragile and conflict affected situationsFranceFrench PolynesiaGabonGambia, TheGeorgiaGermanyGhanaGibraltarGreeceGreenlandGrenadaGuamGuatemalaGuineaGuinea-BissauGuyanaHaitiHeavily indebted poor countries (HIPC)High incomeHondurasHong Kong SAR, ChinaHungaryIBRD onlyIcelandIDA & IBRD totalIDA blendIDA onlyIDA totalIndiaIndonesiaIran, Islamic Rep.IraqIrelandIsraelItalyJamaicaJapanJordanKazakhstanKenyaKiribatiKorea, Dem. People’s Rep.Korea, Rep.KosovoKuwaitKyrgyz RepublicLao PDRLate-demographic dividendLatin America & Caribbean Latin America & Caribbean (excluding high income)Latin America & the Caribbean (IDA & IBRD countries)LatviaLeast developed countries: UN classificationLebanonLiberiaLibyaLithuaniaLow & middle incomeLow incomeLower middle incomeLuxembourgMacao SAR, ChinaMacedonia, FYRMadagascarMalawiMalaysiaMaldivesMaliMaltaMauritaniaMauritiusMexicoMiddle East & North AfricaMiddle East & North Africa (excluding high income)Middle East & North Africa (IDA & IBRD countries)Middle incomeMoldovaMongoliaMontenegroMoroccoMozambiqueMyanmarNauruNepalNetherlandsNew CaledoniaNew ZealandNicaraguaNigerNigeriaNorth AmericaNorwayOECD membersOmanOther small statesPacific island small statesPakistanPanamaPapua New GuineaParaguayPeruPhilippinesPolandPortugalPost-demographic dividendPre-demographic dividendQatarRomaniaRussian FederationRwandaSamoaSao Tome and PrincipeSaudi ArabiaSenegalSerbiaSeychellesSierra LeoneSingaporeSlovak RepublicSloveniaSmall statesSolomon IslandsSomaliaSouth AfricaSouth AsiaSouth Asia (IDA & IBRD)SpainSri LankaSt. Kitts and NevisSt. LuciaSt. Vincent and the GrenadinesSub-Saharan Africa Sub-Saharan Africa (excluding high income)Sub-Saharan Africa (IDA & IBRD countries)SudanSurinameSwedenSwitzerlandSyrian Arab RepublicTajikistanTanzaniaThailandTogoTongaTrinidad and TobagoTunisiaTurkeyTurkmenistanTuvaluUgandaUkraineUnited Arab EmiratesUnited KingdomUnited StatesUpper middle incomeUruguayUzbekistanVanuatuVenezuela, RBVietnamWorldYemen, Rep.ZambiaZimbabwe Timeline:
This timeline shows a graph from 1961 to 2015 of Egypt, Arab Rep.. No data until 1960. Number of actual observations by date: 55.
Source name:
World Development Indicators
Source organization:
World Bank staff estimates based data from International Monetary Fund's Direction of Trade database.
Categories, topics:
Private Sector, Trade
Last updated:
apr 23, 2017
Indicators value changes by year
Minimum:
657.4 mln
jan 1, 1969
Maximum:
68.188 bln
jan 1, 2015
At the date of observation
Value
Absolute change
Change from previous value
jan 1, 1961
664.0 mln
+664.0 mln
0.0%
jan 1, 1962
692.2 mln
+28.2 mln
4.25%
jan 1, 1963
759.1 mln
+66.9 mln
9.66%
jan 1, 1964
916.3 mln
+157.2 mln
20.71%
jan 1, 1965
953.1 mln
+36.8 mln
4.02%
jan 1, 1966
933.3 mln
-19.8 mln
-2.08%
jan 1, 1967
1.07 bln
+136.6 mln
14.64%
jan 1, 1968
791.3 mln
-278.6 mln
-26.04%
jan 1, 1969
657.4 mln
-133.9 mln
-16.92%
jan 1, 1970
667.67 mln
+10.27 mln
1.56%
jan 1, 1971
788.06 mln
+120.39 mln
18.03%
jan 1, 1972
919.95 mln
+131.89 mln
16.74%
jan 1, 1973
888.85 mln
-31.1 mln
-3.38%
jan 1, 1974
908.3 mln
+19.45 mln
2.19%
jan 1, 1975
2.352 bln
+1.443 bln
158.91%
jan 1, 1976
3.934 bln
+1.582 bln
67.27%
jan 1, 1977
3.808 bln
-126.02 mln
-3.2%
jan 1, 1978
4.815 bln
+1.008 bln
26.47%
jan 1, 1979
6.727 bln
+1.911 bln
39.69%
jan 1, 1980
3.837 bln
-2.89 bln
-42.96%
jan 1, 1981
4.86 bln
+1.023 bln
26.67%
jan 1, 1982
8.782 bln
+3.922 bln
80.7%
jan 1, 1983
9.077 bln
+295.19 mln
3.36%
jan 1, 1984
10.276 bln
+1.198 bln
13.2%
jan 1, 1985
10.766 bln
+490.09 mln
4.77%
jan 1, 1986
5.495 bln
-5.27 bln
-48.95%
jan 1, 1987
8.788 bln
+3.292 bln
59.91%
jan 1, 1988
7.595 bln
-1.193 bln
-13.58%
jan 1, 1989
8.659 bln
+1.064 bln
14.01%
jan 1, 1990
7.526 bln
-1.133 bln
-13.08%
jan 1, 1991
9.28 bln
+1.753 bln
23.3%
jan 1, 1992
7.862 bln
-1.418 bln
-15.28%
jan 1, 1993
8.291 bln
+429.267 mln
5.46%
jan 1, 1994
8.195 bln
-96.169 mln
-1.16%
jan 1, 1995
9.452 bln
+1.257 bln
15.33%
jan 1, 1996
11.739 bln
+2.287 bln
24.2%
jan 1, 1997
13.02 bln
+1.281 bln
10.91%
jan 1, 1998
13.168 bln
+148.888 mln
1.14%
jan 1, 1999
16.479 bln
+3.31 bln
25.14%
jan 1, 2000
15.962 bln
-516.745 mln
-3.14%
jan 1, 2001
22.042 bln
+6.08 bln
38.09%
jan 1, 2002
12.72 bln
-9.321 bln
-42.29%
jan 1, 2003
12.496 bln
-224.377 mln
-1.76%
jan 1, 2004
10.893 bln
-1.603 bln
-12.83%
jan 1, 2005
12.841 bln
+1.948 bln
17.89%
jan 1, 2006
19.665 bln
+6.824 bln
53.14%
jan 1, 2007
20.344 bln
+678.396 mln
3.45%
jan 1, 2008
26.711 bln
+6.367 bln
31.3%
jan 1, 2009
52.427 bln
+25.716 bln
96.28%
jan 1, 2010
44.655 bln
-7.772 bln
-14.82%
jan 1, 2011
52.815 bln
+8.16 bln
18.27%
jan 1, 2012
62.156 bln
+9.341 bln
17.69%
jan 1, 2013
67.522 bln
+5.366 bln
8.63%
jan 1, 2014
65.152 bln
-2.37 bln
-3.51%
jan 1, 2015
68.188 bln
+3.036 bln
4.66%
Ranking of countries by current statistics by years


Comments: