29
/
en
AIzaSyAYiBZKx7MnpbEhh9jyipgxe19OcubqV5w
April 1, 2024
267108
Trinidad and Tobago
TTO
true
2
1
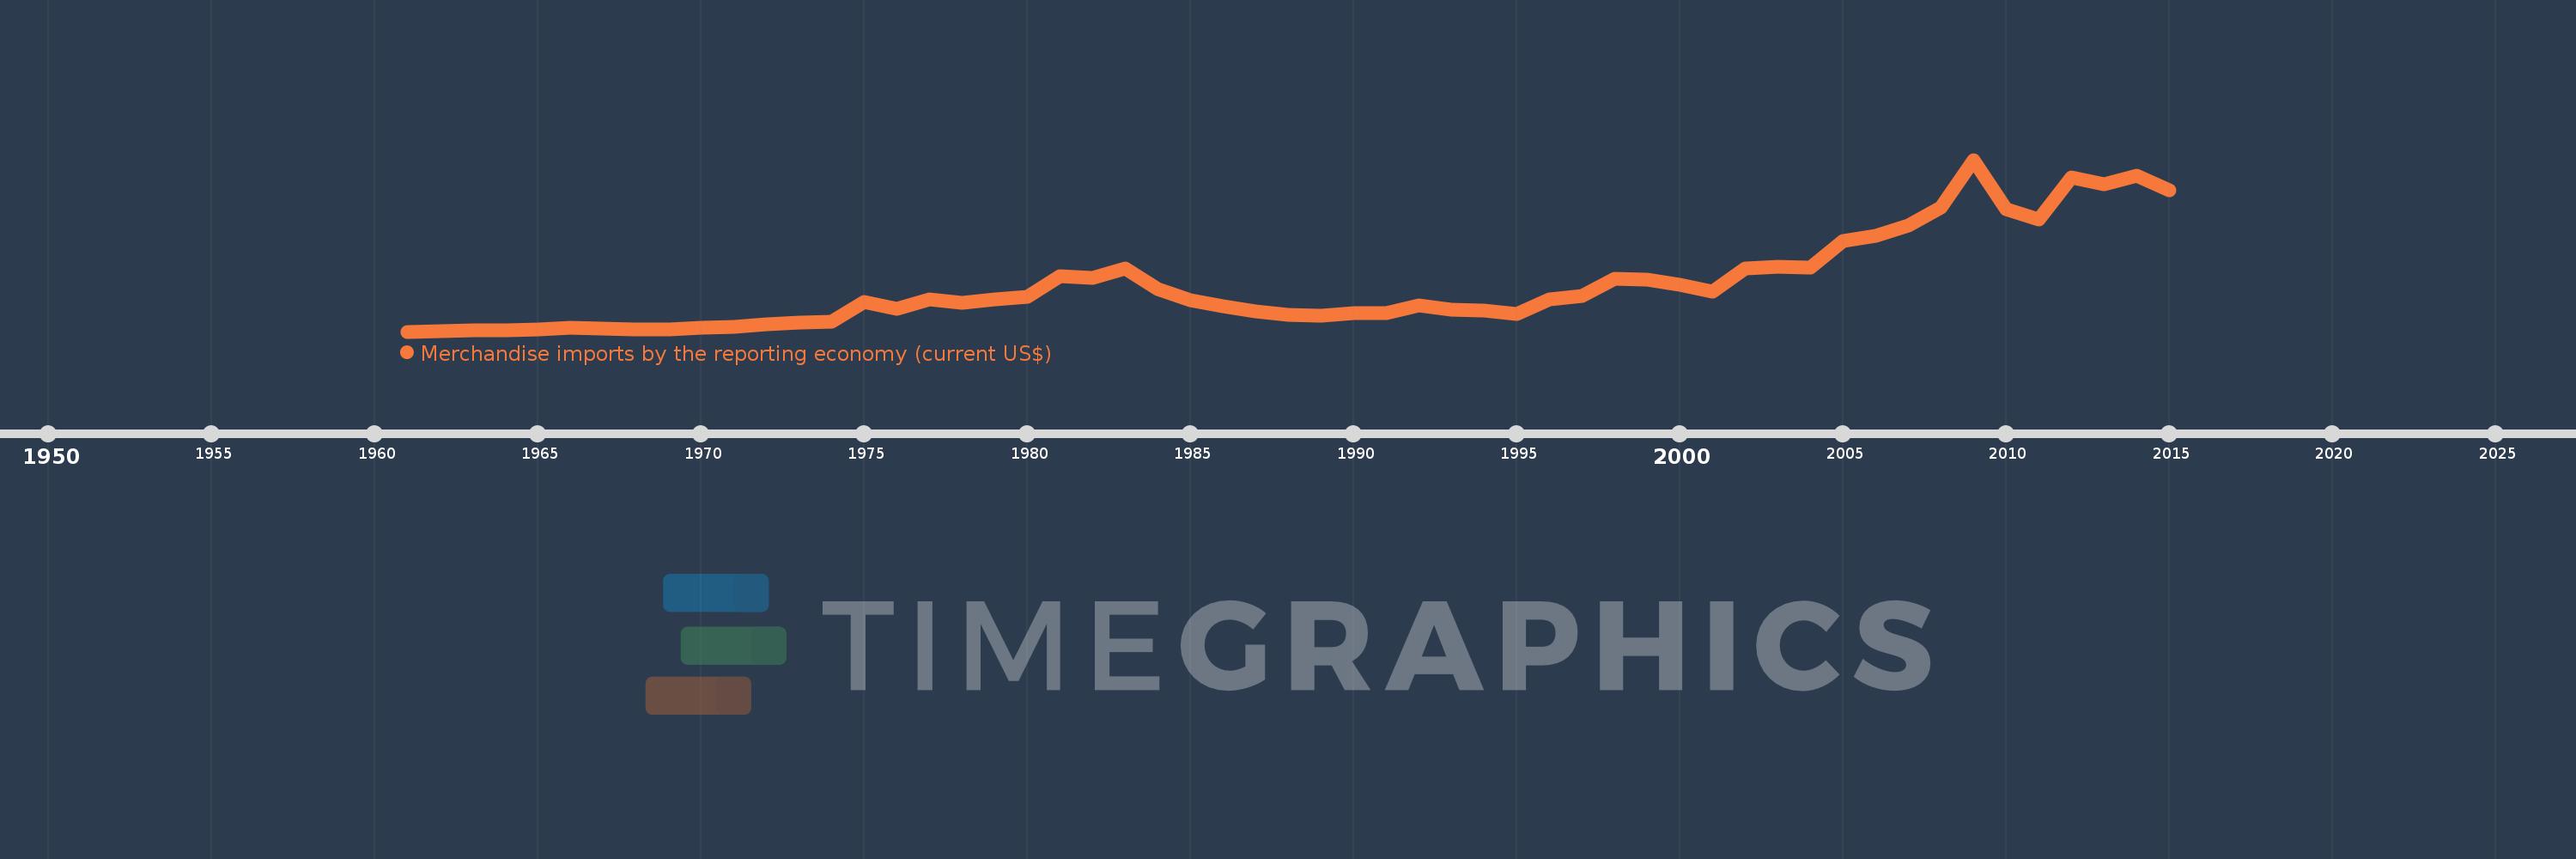
Merchandise imports by the reporting economy (current US$)
2015,2014,2013,2012,2011,2010,2009,2008,2007,2006,2005,2004,2003,2002,2001,2000,1999,1998,1997,1996,1995,1994,1993,1992,1991,1990,1989,1988,1987,1986,1985,1984,1983,1982,1981,1980,1979,1978,1977,1976,1975,1974,1973,1972,1971,1970,1969,1968,1967,1966,1965,1964,1963,1962,1961
This statistics in other country:
AfghanistanAlbaniaAlgeriaAmerican SamoaAngolaAntigua and BarbudaArab WorldArgentinaArmeniaArubaAustraliaAustriaAzerbaijanBahamas, TheBahrainBangladeshBarbadosBelarusBelgiumBelizeBeninBermudaBoliviaBosnia and HerzegovinaBrazilBrunei DarussalamBulgariaBurkina FasoBurundiCabo VerdeCambodiaCameroonCanadaCaribbean small statesCentral African RepublicCentral Europe and the BalticsChadChileChinaColombiaComorosCongo, Dem. Rep.Congo, Rep.Costa RicaCote d'IvoireCroatiaCubaCyprusCzech RepublicDenmarkDjiboutiDominicaDominican RepublicEarly-demographic dividendEast Asia & PacificEast Asia & Pacific (excluding high income)East Asia & Pacific (IDA & IBRD countries)EcuadorEgypt, Arab Rep.El SalvadorEquatorial GuineaEstoniaEthiopiaEuro areaEurope & Central AsiaEurope & Central Asia (excluding high income)Europe & Central Asia (IDA & IBRD countries)European UnionFaroe IslandsFijiFinlandFragile and conflict affected situationsFranceFrench PolynesiaGabonGambia, TheGeorgiaGermanyGhanaGibraltarGreeceGreenlandGrenadaGuamGuatemalaGuineaGuinea-BissauGuyanaHaitiHeavily indebted poor countries (HIPC)High incomeHondurasHong Kong SAR, ChinaHungaryIBRD onlyIcelandIDA & IBRD totalIDA blendIDA onlyIDA totalIndiaIndonesiaIran, Islamic Rep.IraqIrelandIsraelItalyJamaicaJapanJordanKazakhstanKenyaKiribatiKorea, Dem. People’s Rep.Korea, Rep.KosovoKuwaitKyrgyz RepublicLao PDRLate-demographic dividendLatin America & Caribbean Latin America & Caribbean (excluding high income)Latin America & the Caribbean (IDA & IBRD countries)LatviaLeast developed countries: UN classificationLebanonLiberiaLibyaLithuaniaLow & middle incomeLow incomeLower middle incomeLuxembourgMacao SAR, ChinaMacedonia, FYRMadagascarMalawiMalaysiaMaldivesMaliMaltaMauritaniaMauritiusMexicoMiddle East & North AfricaMiddle East & North Africa (excluding high income)Middle East & North Africa (IDA & IBRD countries)Middle incomeMoldovaMongoliaMontenegroMoroccoMozambiqueMyanmarNauruNepalNetherlandsNew CaledoniaNew ZealandNicaraguaNigerNigeriaNorth AmericaNorwayOECD membersOmanOther small statesPacific island small statesPakistanPanamaPapua New GuineaParaguayPeruPhilippinesPolandPortugalPost-demographic dividendPre-demographic dividendQatarRomaniaRussian FederationRwandaSamoaSao Tome and PrincipeSaudi ArabiaSenegalSerbiaSeychellesSierra LeoneSingaporeSlovak RepublicSloveniaSmall statesSolomon IslandsSomaliaSouth AfricaSouth AsiaSouth Asia (IDA & IBRD)SpainSri LankaSt. Kitts and NevisSt. LuciaSt. Vincent and the GrenadinesSub-Saharan Africa Sub-Saharan Africa (excluding high income)Sub-Saharan Africa (IDA & IBRD countries)SudanSurinameSwedenSwitzerlandSyrian Arab RepublicTajikistanTanzaniaThailandTogoTongaTrinidad and TobagoTunisiaTurkeyTurkmenistanTuvaluUgandaUkraineUnited Arab EmiratesUnited KingdomUnited StatesUpper middle incomeUruguayUzbekistanVanuatuVenezuela, RBVietnamWorldYemen, Rep.ZambiaZimbabwe Timeline:
This timeline shows a graph from 1961 to 2015 of Trinidad and Tobago. No data until 1960. Number of actual observations by date: 55.
Source name:
World Development Indicators
Source organization:
World Bank staff estimates based data from International Monetary Fund's Direction of Trade database.
Categories, topics:
Private Sector, Trade
Last updated:
apr 23, 2017
Indicators value changes by year
Minimum:
292.4 mln
jan 1, 1961
Maximum:
9.211 bln
jan 1, 2009
At the date of observation
Value
Absolute change
Change from previous value
jan 1, 1961
292.4 mln
+292.4 mln
0.0%
jan 1, 1962
335.7 mln
+43.3 mln
14.81%
jan 1, 1963
353.2 mln
+17.5 mln
5.21%
jan 1, 1964
375.4 mln
+22.2 mln
6.29%
jan 1, 1965
422.8 mln
+47.4 mln
12.63%
jan 1, 1966
474.4 mln
+51.6 mln
12.2%
jan 1, 1967
457.6 mln
-16.8 mln
-3.54%
jan 1, 1968
411.2 mln
-46.4 mln
-10.14%
jan 1, 1969
420.0 mln
+8.8 mln
2.14%
jan 1, 1970
484.37 mln
+64.37 mln
15.33%
jan 1, 1971
543.71 mln
+59.34 mln
12.25%
jan 1, 1972
657.12 mln
+113.41 mln
20.86%
jan 1, 1973
764.69 mln
+107.57 mln
16.37%
jan 1, 1974
788.39 mln
+23.7 mln
3.1%
jan 1, 1975
1.847 bln
+1.059 bln
134.31%
jan 1, 1976
1.472 bln
-375.45 mln
-20.32%
jan 1, 1977
1.968 bln
+496.13 mln
33.71%
jan 1, 1978
1.789 bln
-179.14 mln
-9.1%
jan 1, 1979
1.961 bln
+172.21 mln
9.63%
jan 1, 1980
2.083 bln
+121.63 mln
6.2%
jan 1, 1981
3.159 bln
+1.076 bln
51.68%
jan 1, 1982
3.101 bln
-57.61 mln
-1.82%
jan 1, 1983
3.564 bln
+462.9 mln
14.93%
jan 1, 1984
2.503 bln
-1.061 bln
-29.78%
jan 1, 1985
1.902 bln
-600.93 mln
-24.01%
jan 1, 1986
1.588 bln
-313.56 mln
-16.49%
jan 1, 1987
1.332 bln
-256.18 mln
-16.13%
jan 1, 1988
1.166 bln
-166.15 mln
-12.47%
jan 1, 1989
1.128 bln
-37.73 mln
-3.24%
jan 1, 1990
1.244 bln
+116.056 mln
10.29%
jan 1, 1991
1.23 bln
-14.667 mln
-1.18%
jan 1, 1992
1.647 bln
+417.478 mln
33.95%
jan 1, 1993
1.43 bln
-216.803 mln
-13.16%
jan 1, 1994
1.387 bln
-43.448 mln
-3.04%
jan 1, 1995
1.212 bln
-175.011 mln
-12.62%
jan 1, 1996
1.968 bln
+755.91 mln
62.38%
jan 1, 1997
2.147 bln
+179.497 mln
9.12%
jan 1, 1998
3.028 bln
+880.859 mln
41.02%
jan 1, 1999
3.009 bln
-18.928 mln
-0.63%
jan 1, 2000
2.743 bln
-266.18 mln
-8.85%
jan 1, 2001
2.353 bln
-390.122 mln
-14.22%
jan 1, 2002
3.561 bln
+1.209 bln
51.37%
jan 1, 2003
3.66 bln
+98.95 mln
2.78%
jan 1, 2004
3.629 bln
-31.161 mln
-0.85%
jan 1, 2005
4.998 bln
+1.368 bln
37.7%
jan 1, 2006
5.273 bln
+275.685 mln
5.52%
jan 1, 2007
5.817 bln
+543.315 mln
10.3%
jan 1, 2008
6.729 bln
+912.116 mln
15.68%
jan 1, 2009
9.211 bln
+2.483 bln
36.89%
jan 1, 2010
6.662 bln
-2.549 bln
-27.67%
jan 1, 2011
6.097 bln
-564.933 mln
-8.48%
jan 1, 2012
8.285 bln
+2.188 bln
35.88%
jan 1, 2013
7.933 bln
-352.049 mln
-4.25%
jan 1, 2014
8.396 bln
+462.319 mln
5.83%
jan 1, 2015
7.63 bln
-765.762 mln
-9.12%
Ranking of countries by current statistics by years


Comments: