29
/
en
AIzaSyAYiBZKx7MnpbEhh9jyipgxe19OcubqV5w
April 1, 2024
132256
Fiji
FJI
true
2
1
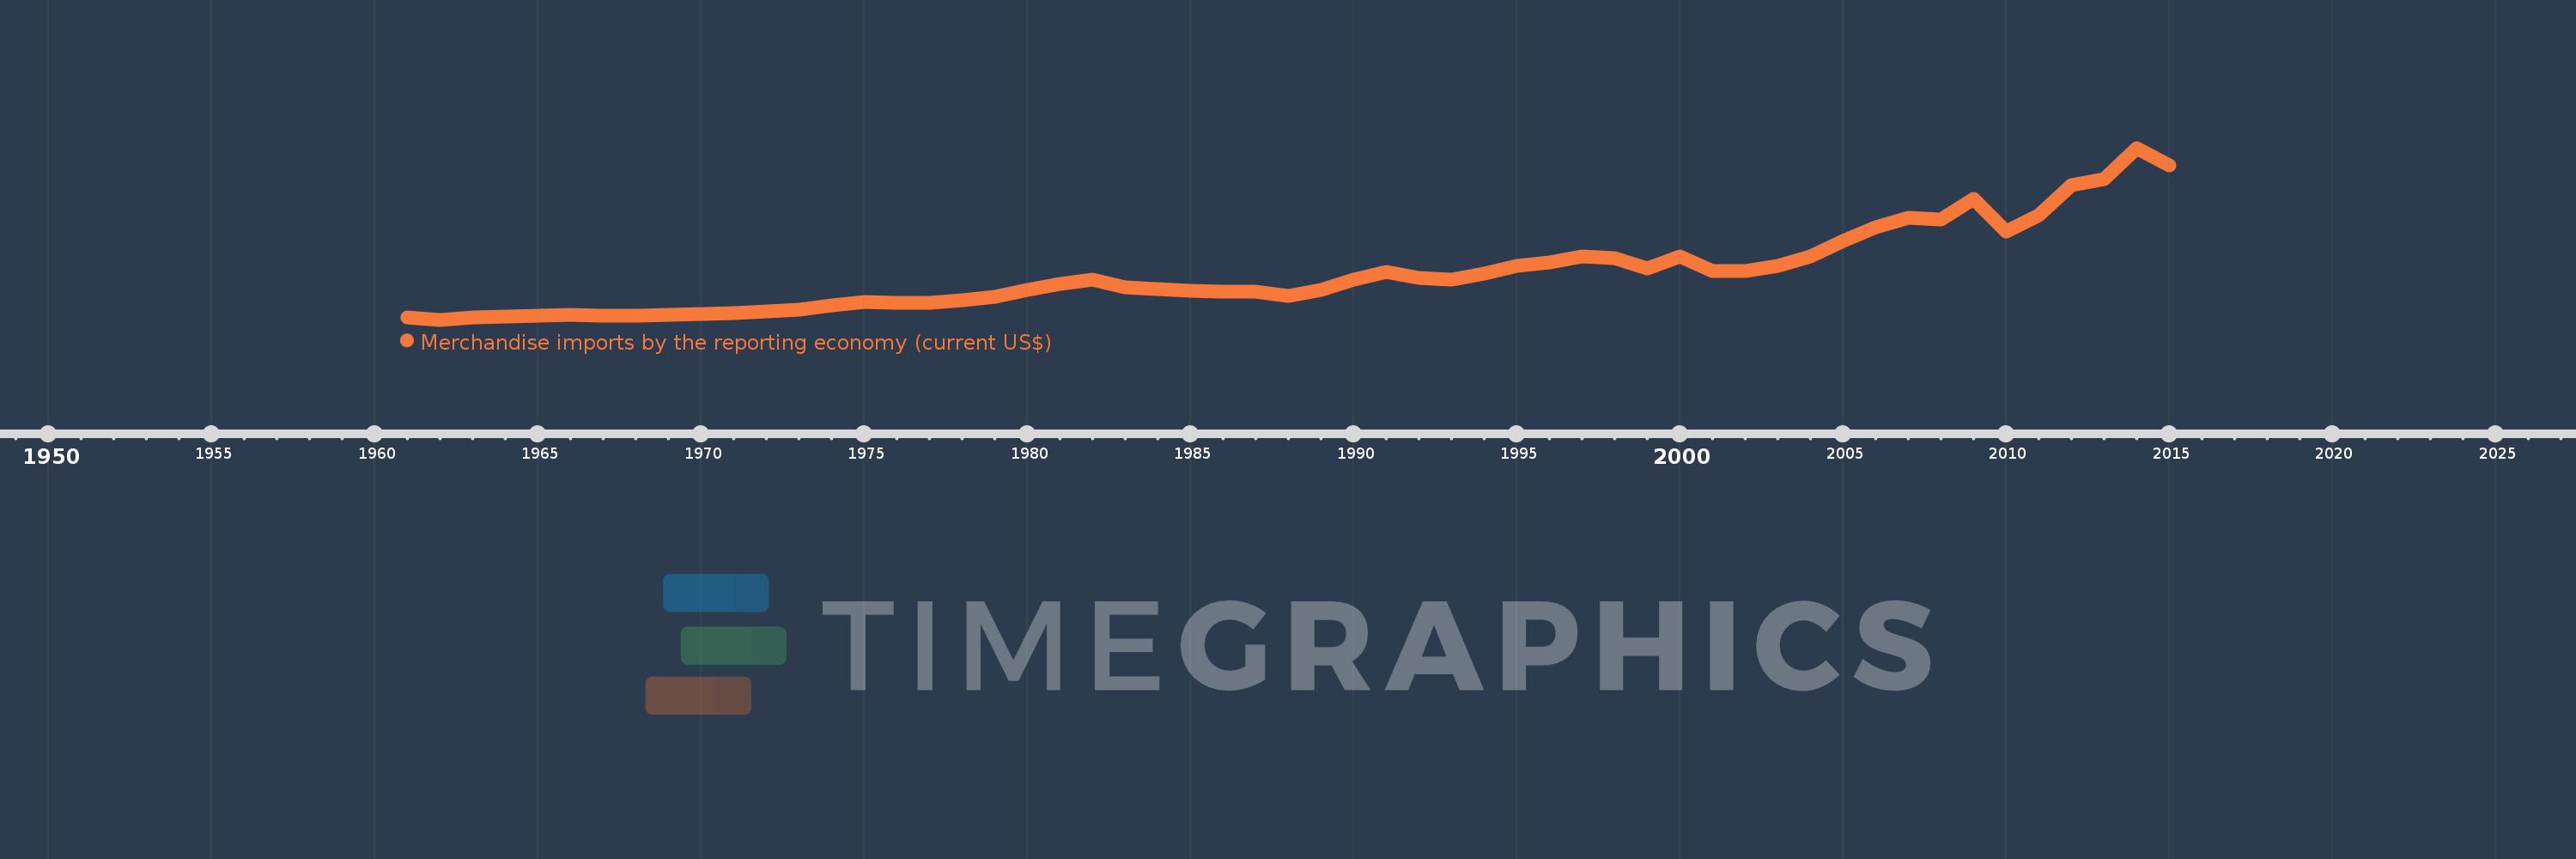
Merchandise imports by the reporting economy (current US$)
2015,2014,2013,2012,2011,2010,2009,2008,2007,2006,2005,2004,2003,2002,2001,2000,1999,1998,1997,1996,1995,1994,1993,1992,1991,1990,1989,1988,1987,1986,1985,1984,1983,1982,1981,1980,1979,1978,1977,1976,1975,1974,1973,1972,1971,1970,1969,1968,1967,1966,1965,1964,1963,1962,1961
This statistics in other country:
AfghanistanAlbaniaAlgeriaAmerican SamoaAngolaAntigua and BarbudaArab WorldArgentinaArmeniaArubaAustraliaAustriaAzerbaijanBahamas, TheBahrainBangladeshBarbadosBelarusBelgiumBelizeBeninBermudaBoliviaBosnia and HerzegovinaBrazilBrunei DarussalamBulgariaBurkina FasoBurundiCabo VerdeCambodiaCameroonCanadaCaribbean small statesCentral African RepublicCentral Europe and the BalticsChadChileChinaColombiaComorosCongo, Dem. Rep.Congo, Rep.Costa RicaCote d'IvoireCroatiaCubaCyprusCzech RepublicDenmarkDjiboutiDominicaDominican RepublicEarly-demographic dividendEast Asia & PacificEast Asia & Pacific (excluding high income)East Asia & Pacific (IDA & IBRD countries)EcuadorEgypt, Arab Rep.El SalvadorEquatorial GuineaEstoniaEthiopiaEuro areaEurope & Central AsiaEurope & Central Asia (excluding high income)Europe & Central Asia (IDA & IBRD countries)European UnionFaroe IslandsFijiFinlandFragile and conflict affected situationsFranceFrench PolynesiaGabonGambia, TheGeorgiaGermanyGhanaGibraltarGreeceGreenlandGrenadaGuamGuatemalaGuineaGuinea-BissauGuyanaHaitiHeavily indebted poor countries (HIPC)High incomeHondurasHong Kong SAR, ChinaHungaryIBRD onlyIcelandIDA & IBRD totalIDA blendIDA onlyIDA totalIndiaIndonesiaIran, Islamic Rep.IraqIrelandIsraelItalyJamaicaJapanJordanKazakhstanKenyaKiribatiKorea, Dem. People’s Rep.Korea, Rep.KosovoKuwaitKyrgyz RepublicLao PDRLate-demographic dividendLatin America & Caribbean Latin America & Caribbean (excluding high income)Latin America & the Caribbean (IDA & IBRD countries)LatviaLeast developed countries: UN classificationLebanonLiberiaLibyaLithuaniaLow & middle incomeLow incomeLower middle incomeLuxembourgMacao SAR, ChinaMacedonia, FYRMadagascarMalawiMalaysiaMaldivesMaliMaltaMauritaniaMauritiusMexicoMiddle East & North AfricaMiddle East & North Africa (excluding high income)Middle East & North Africa (IDA & IBRD countries)Middle incomeMoldovaMongoliaMontenegroMoroccoMozambiqueMyanmarNauruNepalNetherlandsNew CaledoniaNew ZealandNicaraguaNigerNigeriaNorth AmericaNorwayOECD membersOmanOther small statesPacific island small statesPakistanPanamaPapua New GuineaParaguayPeruPhilippinesPolandPortugalPost-demographic dividendPre-demographic dividendQatarRomaniaRussian FederationRwandaSamoaSao Tome and PrincipeSaudi ArabiaSenegalSerbiaSeychellesSierra LeoneSingaporeSlovak RepublicSloveniaSmall statesSolomon IslandsSomaliaSouth AfricaSouth AsiaSouth Asia (IDA & IBRD)SpainSri LankaSt. Kitts and NevisSt. LuciaSt. Vincent and the GrenadinesSub-Saharan Africa Sub-Saharan Africa (excluding high income)Sub-Saharan Africa (IDA & IBRD countries)SudanSurinameSwedenSwitzerlandSyrian Arab RepublicTajikistanTanzaniaThailandTogoTongaTrinidad and TobagoTunisiaTurkeyTurkmenistanTuvaluUgandaUkraineUnited Arab EmiratesUnited KingdomUnited StatesUpper middle incomeUruguayUzbekistanVanuatuVenezuela, RBVietnamWorldYemen, Rep.ZambiaZimbabwe Timeline:
This timeline shows a graph from 1961 to 2015 of Fiji. No data until 1960. Number of actual observations by date: 55.
Source name:
World Development Indicators
Source organization:
World Bank staff estimates based data from International Monetary Fund's Direction of Trade database.
Categories, topics:
Private Sector, Trade
Last updated:
apr 23, 2017
Indicators value changes by year
Minimum:
1.2 mln
jan 1, 1962
Maximum:
2.688 bln
jan 1, 2014
At the date of observation
Value
Absolute change
Change from previous value
jan 1, 1961
41.2 mln
+41.2 mln
0.0%
jan 1, 1962
1.2 mln
-40.0 mln
-97.09%
jan 1, 1963
43.3 mln
+42.1 mln
3.51K%
jan 1, 1964
50.8 mln
+7.5 mln
17.32%
jan 1, 1965
68.1 mln
+17.3 mln
34.06%
jan 1, 1966
71.5 mln
+3.4 mln
4.99%
jan 1, 1967
63.5 mln
-8.0 mln
-11.19%
jan 1, 1968
68.8 mln
+5.3 mln
8.35%
jan 1, 1969
73.7 mln
+4.9 mln
7.12%
jan 1, 1970
89.452 mln
+15.752 mln
21.37%
jan 1, 1971
103.907 mln
+14.455 mln
16.16%
jan 1, 1972
128.1 mln
+24.193 mln
23.28%
jan 1, 1973
158.203 mln
+30.103 mln
23.5%
jan 1, 1974
219.913 mln
+61.71 mln
39.01%
jan 1, 1975
273.168 mln
+53.255 mln
24.22%
jan 1, 1976
268.906 mln
-4.262 mln
-1.56%
jan 1, 1977
261.028 mln
-7.878 mln
-2.93%
jan 1, 1978
306.682 mln
+45.654 mln
17.49%
jan 1, 1979
353.357 mln
+46.675 mln
15.22%
jan 1, 1980
470.258 mln
+116.901 mln
33.08%
jan 1, 1981
559.306 mln
+89.048 mln
18.94%
jan 1, 1982
631.638 mln
+72.332 mln
12.93%
jan 1, 1983
509.47 mln
-122.168 mln
-19.34%
jan 1, 1984
484.461 mln
-25.009 mln
-4.91%
jan 1, 1985
449.835 mln
-34.626 mln
-7.15%
jan 1, 1986
441.481 mln
-8.354 mln
-1.86%
jan 1, 1987
435.707 mln
-5.774 mln
-1.31%
jan 1, 1988
373.936 mln
-61.772 mln
-14.18%
jan 1, 1989
461.568 mln
+87.632 mln
23.44%
jan 1, 1990
631.654 mln
+170.086 mln
36.85%
jan 1, 1991
755.161 mln
+123.507 mln
19.55%
jan 1, 1992
652.07 mln
-103.092 mln
-13.65%
jan 1, 1993
630.315 mln
-21.755 mln
-3.34%
jan 1, 1994
719.824 mln
+89.509 mln
14.2%
jan 1, 1995
850.115 mln
+130.291 mln
18.1%
jan 1, 1996
891.571 mln
+41.456 mln
4.88%
jan 1, 1997
986.616 mln
+95.045 mln
10.66%
jan 1, 1998
964.683 mln
-21.933 mln
-2.22%
jan 1, 1999
800.991 mln
-163.692 mln
-16.97%
jan 1, 2000
991.224 mln
+190.232 mln
23.75%
jan 1, 2001
762.346 mln
-228.878 mln
-23.09%
jan 1, 2002
763.738 mln
+1.392 mln
0.18%
jan 1, 2003
845.677 mln
+81.939 mln
10.73%
jan 1, 2004
994.709 mln
+149.032 mln
17.62%
jan 1, 2005
1.231 bln
+236.597 mln
23.79%
jan 1, 2006
1.451 bln
+219.243 mln
17.81%
jan 1, 2007
1.592 bln
+141.901 mln
9.78%
jan 1, 2008
1.57 bln
-22.337 mln
-1.4%
jan 1, 2009
1.897 bln
+327.147 mln
20.84%
jan 1, 2010
1.383 bln
-514.658 mln
-27.13%
jan 1, 2011
1.633 bln
+250.371 mln
18.11%
jan 1, 2012
2.111 bln
+477.715 mln
29.25%
jan 1, 2013
2.2 bln
+89.774 mln
4.25%
jan 1, 2014
2.688 bln
+487.401 mln
22.15%
jan 1, 2015
2.421 bln
-267.009 mln
-9.93%
Ranking of countries by current statistics by years


Comments: