29
/
en
AIzaSyAYiBZKx7MnpbEhh9jyipgxe19OcubqV5w
April 1, 2024
39197
IDA only
IDX
false
2
1
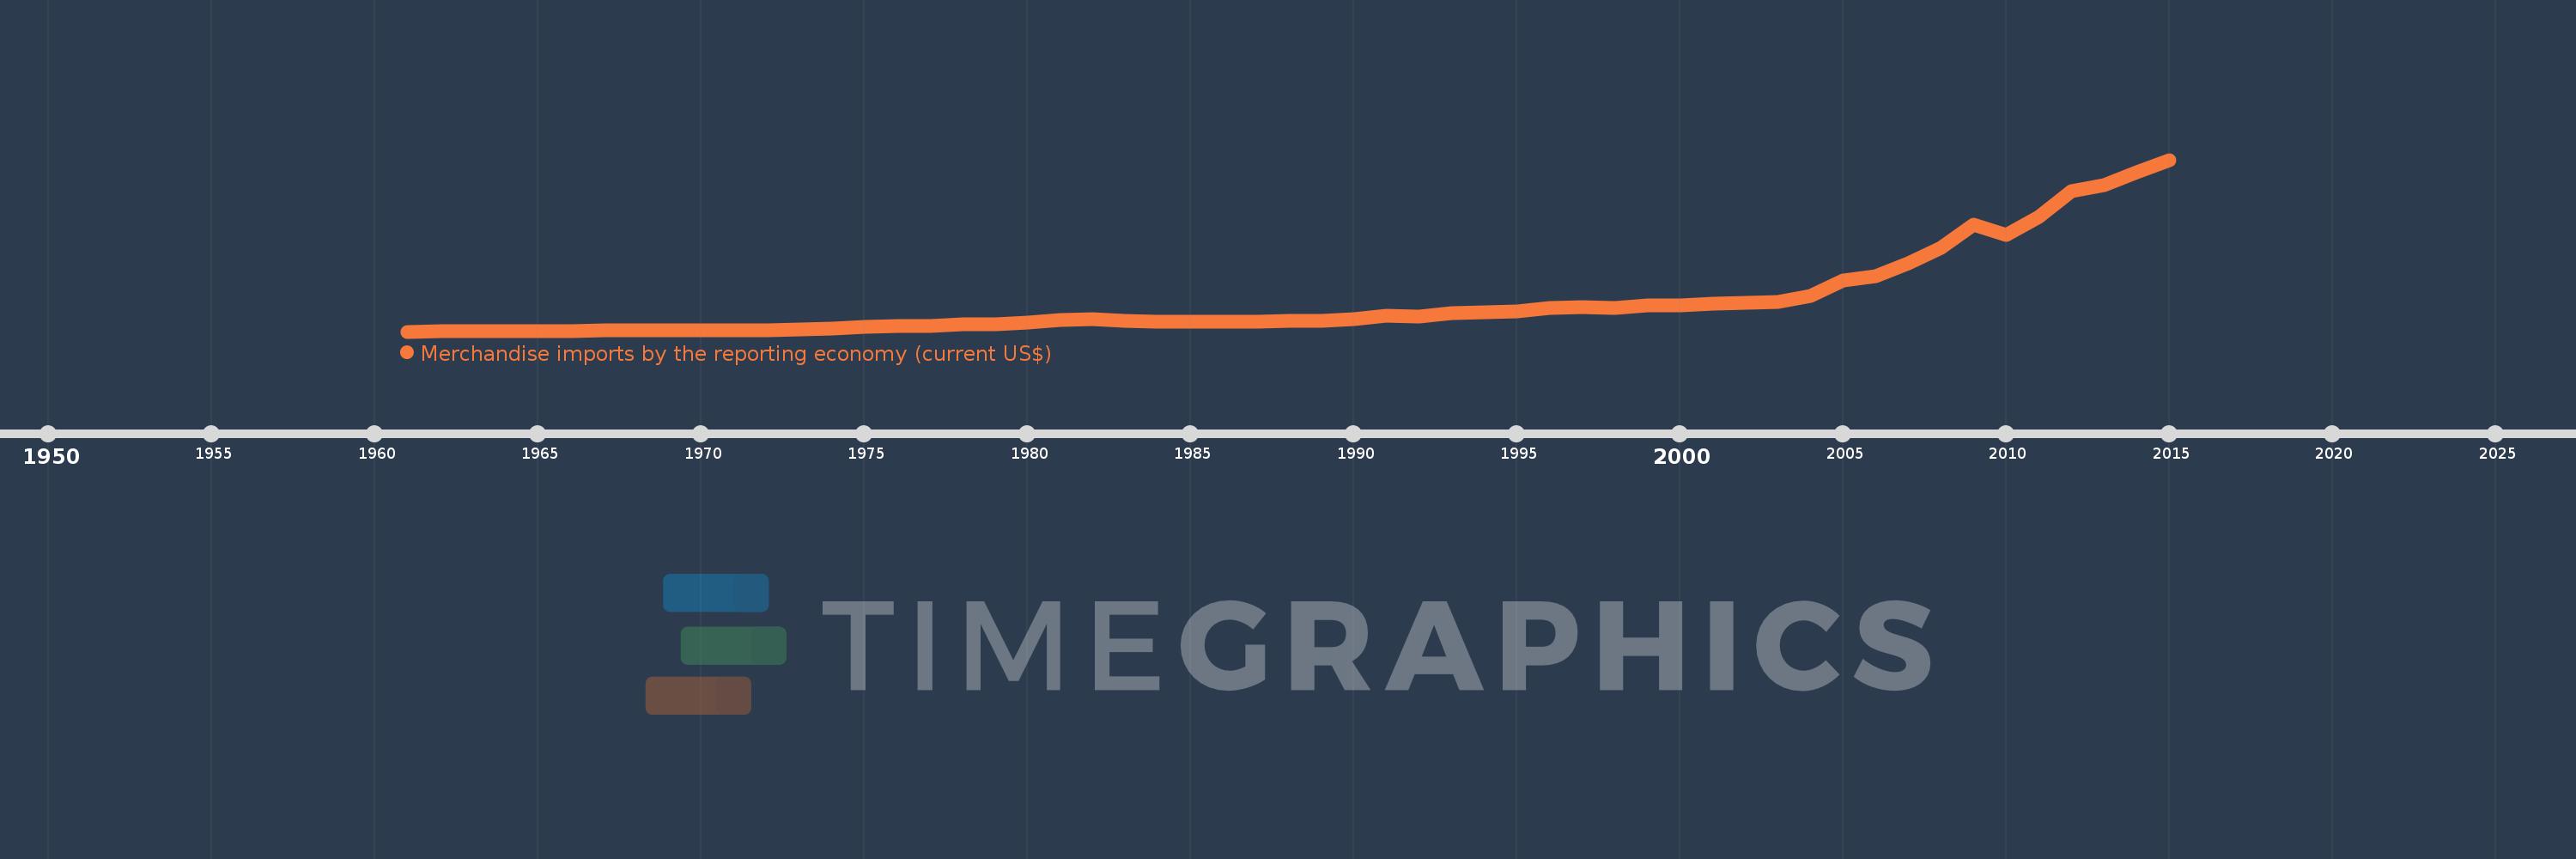
Merchandise imports by the reporting economy (current US$)
2015,2014,2013,2012,2011,2010,2009,2008,2007,2006,2005,2004,2003,2002,2001,2000,1999,1998,1997,1996,1995,1994,1993,1992,1991,1990,1989,1988,1987,1986,1985,1984,1983,1982,1981,1980,1979,1978,1977,1976,1975,1974,1973,1972,1971,1970,1969,1968,1967,1966,1965,1964,1963,1962,1961
This statistics in other country:
AfghanistanAlbaniaAlgeriaAmerican SamoaAngolaAntigua and BarbudaArab WorldArgentinaArmeniaArubaAustraliaAustriaAzerbaijanBahamas, TheBahrainBangladeshBarbadosBelarusBelgiumBelizeBeninBermudaBoliviaBosnia and HerzegovinaBrazilBrunei DarussalamBulgariaBurkina FasoBurundiCabo VerdeCambodiaCameroonCanadaCaribbean small statesCentral African RepublicCentral Europe and the BalticsChadChileChinaColombiaComorosCongo, Dem. Rep.Congo, Rep.Costa RicaCote d'IvoireCroatiaCubaCyprusCzech RepublicDenmarkDjiboutiDominicaDominican RepublicEarly-demographic dividendEast Asia & PacificEast Asia & Pacific (excluding high income)East Asia & Pacific (IDA & IBRD countries)EcuadorEgypt, Arab Rep.El SalvadorEquatorial GuineaEstoniaEthiopiaEuro areaEurope & Central AsiaEurope & Central Asia (excluding high income)Europe & Central Asia (IDA & IBRD countries)European UnionFaroe IslandsFijiFinlandFragile and conflict affected situationsFranceFrench PolynesiaGabonGambia, TheGeorgiaGermanyGhanaGibraltarGreeceGreenlandGrenadaGuamGuatemalaGuineaGuinea-BissauGuyanaHaitiHeavily indebted poor countries (HIPC)High incomeHondurasHong Kong SAR, ChinaHungaryIBRD onlyIcelandIDA & IBRD totalIDA blendIDA onlyIDA totalIndiaIndonesiaIran, Islamic Rep.IraqIrelandIsraelItalyJamaicaJapanJordanKazakhstanKenyaKiribatiKorea, Dem. People’s Rep.Korea, Rep.KosovoKuwaitKyrgyz RepublicLao PDRLate-demographic dividendLatin America & Caribbean Latin America & Caribbean (excluding high income)Latin America & the Caribbean (IDA & IBRD countries)LatviaLeast developed countries: UN classificationLebanonLiberiaLibyaLithuaniaLow & middle incomeLow incomeLower middle incomeLuxembourgMacao SAR, ChinaMacedonia, FYRMadagascarMalawiMalaysiaMaldivesMaliMaltaMauritaniaMauritiusMexicoMiddle East & North AfricaMiddle East & North Africa (excluding high income)Middle East & North Africa (IDA & IBRD countries)Middle incomeMoldovaMongoliaMontenegroMoroccoMozambiqueMyanmarNauruNepalNetherlandsNew CaledoniaNew ZealandNicaraguaNigerNigeriaNorth AmericaNorwayOECD membersOmanOther small statesPacific island small statesPakistanPanamaPapua New GuineaParaguayPeruPhilippinesPolandPortugalPost-demographic dividendPre-demographic dividendQatarRomaniaRussian FederationRwandaSamoaSao Tome and PrincipeSaudi ArabiaSenegalSerbiaSeychellesSierra LeoneSingaporeSlovak RepublicSloveniaSmall statesSolomon IslandsSomaliaSouth AfricaSouth AsiaSouth Asia (IDA & IBRD)SpainSri LankaSt. Kitts and NevisSt. LuciaSt. Vincent and the GrenadinesSub-Saharan Africa Sub-Saharan Africa (excluding high income)Sub-Saharan Africa (IDA & IBRD countries)SudanSurinameSwedenSwitzerlandSyrian Arab RepublicTajikistanTanzaniaThailandTogoTongaTrinidad and TobagoTunisiaTurkeyTurkmenistanTuvaluUgandaUkraineUnited Arab EmiratesUnited KingdomUnited StatesUpper middle incomeUruguayUzbekistanVanuatuVenezuela, RBVietnamWorldYemen, Rep.ZambiaZimbabwe Timeline:
This timeline shows a graph from 1961 to 2015 of IDA only. No data until 1960. Number of actual observations by date: 55.
Source name:
World Development Indicators
Source organization:
World Bank staff estimates based data from International Monetary Fund's Direction of Trade database.
Categories, topics:
Private Sector, Trade
Last updated:
apr 23, 2017
Indicators value changes by year
Minimum:
2.546 bln
jan 1, 1961
Maximum:
388.812 bln
jan 1, 2015
At the date of observation
Value
Absolute change
Change from previous value
jan 1, 1961
2.546 bln
+2.546 bln
0.0%
jan 1, 1962
2.577 bln
+30.704 mln
1.21%
jan 1, 1963
2.722 bln
+144.904 mln
5.62%
jan 1, 1964
3.219 bln
+497.288 mln
18.27%
jan 1, 1965
3.936 bln
+716.344 mln
22.25%
jan 1, 1966
4.248 bln
+312.643 mln
7.94%
jan 1, 1967
4.509 bln
+260.496 mln
6.13%
jan 1, 1968
4.616 bln
+107.397 mln
2.38%
jan 1, 1969
5.132 bln
+515.466 mln
11.17%
jan 1, 1970
5.52 bln
+388.135 mln
7.56%
jan 1, 1971
6.258 bln
+738.585 mln
13.38%
jan 1, 1972
6.322 bln
+63.875 mln
1.02%
jan 1, 1973
7.08 bln
+757.428 mln
11.98%
jan 1, 1974
9.736 bln
+2.657 bln
37.53%
jan 1, 1975
13.983 bln
+4.247 bln
43.62%
jan 1, 1976
15.807 bln
+1.824 bln
13.04%
jan 1, 1977
15.139 bln
-667.853 mln
-4.23%
jan 1, 1978
18.611 bln
+3.471 bln
22.93%
jan 1, 1979
19.916 bln
+1.305 bln
7.01%
jan 1, 1980
22.474 bln
+2.558 bln
12.84%
jan 1, 1981
28.986 bln
+6.512 bln
28.98%
jan 1, 1982
31.382 bln
+2.396 bln
8.27%
jan 1, 1983
27.242 bln
-4.14 bln
-13.19%
jan 1, 1984
25.616 bln
-1.626 bln
-5.97%
jan 1, 1985
25.025 bln
-590.967 mln
-2.31%
jan 1, 1986
25.56 bln
+535.074 mln
2.14%
jan 1, 1987
24.763 bln
-797.484 mln
-3.12%
jan 1, 1988
27.048 bln
+2.285 bln
9.23%
jan 1, 1989
27.579 bln
+531.225 mln
1.96%
jan 1, 1990
29.632 bln
+2.053 bln
7.44%
jan 1, 1991
39.143 bln
+9.511 bln
32.1%
jan 1, 1992
37.269 bln
-1.874 bln
-4.79%
jan 1, 1993
44.677 bln
+7.408 bln
19.88%
jan 1, 1994
45.282 bln
+604.944 mln
1.35%
jan 1, 1995
48.083 bln
+2.801 bln
6.19%
jan 1, 1996
56.087 bln
+8.004 bln
16.65%
jan 1, 1997
57.882 bln
+1.795 bln
3.2%
jan 1, 1998
56.558 bln
-1.324 bln
-2.29%
jan 1, 1999
61.431 bln
+4.873 bln
8.62%
jan 1, 2000
61.677 bln
+245.426 mln
0.4%
jan 1, 2001
64.601 bln
+2.924 bln
4.74%
jan 1, 2002
66.804 bln
+2.204 bln
3.41%
jan 1, 2003
69.362 bln
+2.557 bln
3.83%
jan 1, 2004
83.653 bln
+14.292 bln
20.6%
jan 1, 2005
117.15 bln
+33.497 bln
40.04%
jan 1, 2006
127.492 bln
+10.342 bln
8.83%
jan 1, 2007
155.299 bln
+27.807 bln
21.81%
jan 1, 2008
189.89 bln
+34.59 bln
22.27%
jan 1, 2009
242.335 bln
+52.446 bln
27.62%
jan 1, 2010
220.568 bln
-21.767 bln
-8.98%
jan 1, 2011
261.211 bln
+40.643 bln
18.43%
jan 1, 2012
318.419 bln
+57.208 bln
21.9%
jan 1, 2013
331.369 bln
+12.95 bln
4.07%
jan 1, 2014
360.691 bln
+29.323 bln
8.85%
jan 1, 2015
388.812 bln
+28.121 bln
7.8%
Ranking of countries by current statistics by years


Comments: