29
/
en
AIzaSyAYiBZKx7MnpbEhh9jyipgxe19OcubqV5w
April 1, 2024
276898
United States
USA
true
2
1
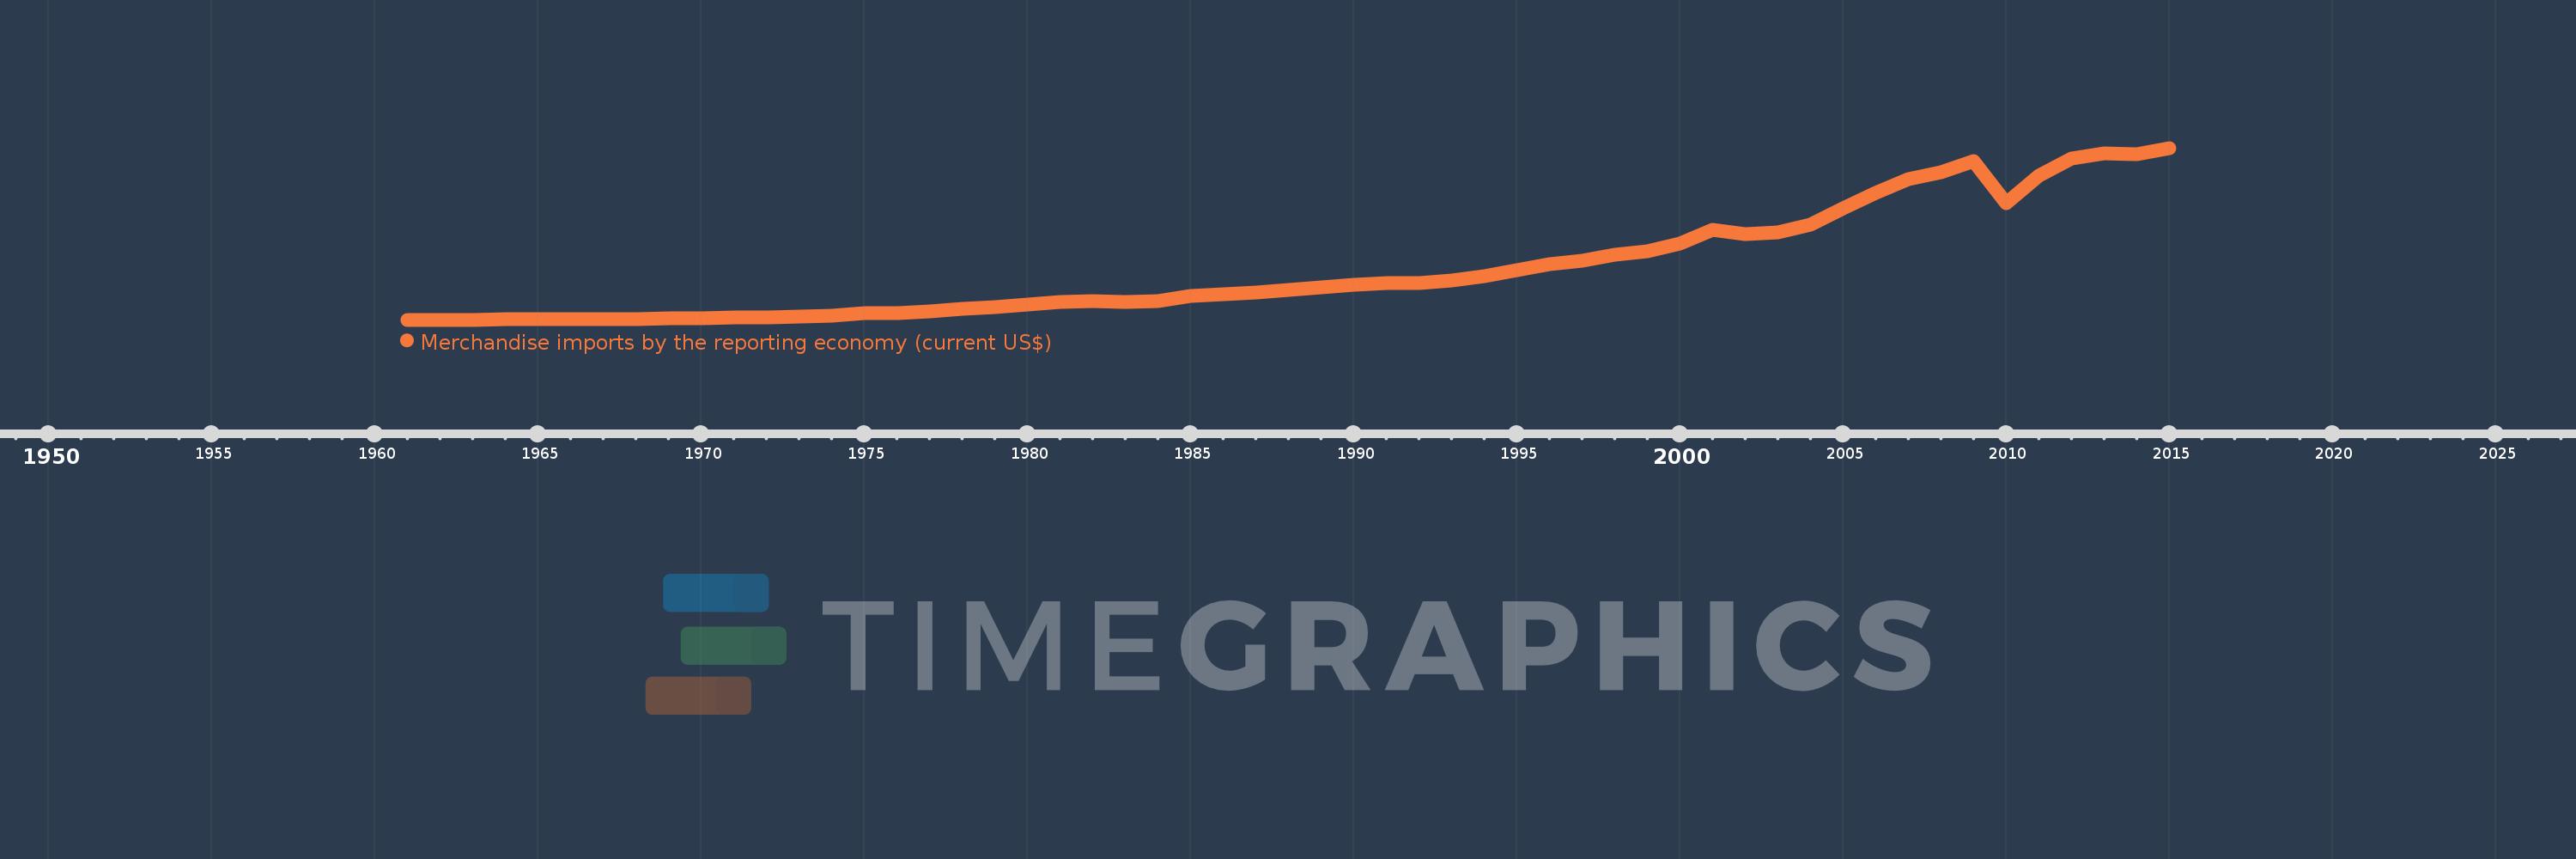
Merchandise imports by the reporting economy (current US$)
2015,2014,2013,2012,2011,2010,2009,2008,2007,2006,2005,2004,2003,2002,2001,2000,1999,1998,1997,1996,1995,1994,1993,1992,1991,1990,1989,1988,1987,1986,1985,1984,1983,1982,1981,1980,1979,1978,1977,1976,1975,1974,1973,1972,1971,1970,1969,1968,1967,1966,1965,1964,1963,1962,1961
This statistics in other country:
AfghanistanAlbaniaAlgeriaAmerican SamoaAngolaAntigua and BarbudaArab WorldArgentinaArmeniaArubaAustraliaAustriaAzerbaijanBahamas, TheBahrainBangladeshBarbadosBelarusBelgiumBelizeBeninBermudaBoliviaBosnia and HerzegovinaBrazilBrunei DarussalamBulgariaBurkina FasoBurundiCabo VerdeCambodiaCameroonCanadaCaribbean small statesCentral African RepublicCentral Europe and the BalticsChadChileChinaColombiaComorosCongo, Dem. Rep.Congo, Rep.Costa RicaCote d'IvoireCroatiaCubaCyprusCzech RepublicDenmarkDjiboutiDominicaDominican RepublicEarly-demographic dividendEast Asia & PacificEast Asia & Pacific (excluding high income)East Asia & Pacific (IDA & IBRD countries)EcuadorEgypt, Arab Rep.El SalvadorEquatorial GuineaEstoniaEthiopiaEuro areaEurope & Central AsiaEurope & Central Asia (excluding high income)Europe & Central Asia (IDA & IBRD countries)European UnionFaroe IslandsFijiFinlandFragile and conflict affected situationsFranceFrench PolynesiaGabonGambia, TheGeorgiaGermanyGhanaGibraltarGreeceGreenlandGrenadaGuamGuatemalaGuineaGuinea-BissauGuyanaHaitiHeavily indebted poor countries (HIPC)High incomeHondurasHong Kong SAR, ChinaHungaryIBRD onlyIcelandIDA & IBRD totalIDA blendIDA onlyIDA totalIndiaIndonesiaIran, Islamic Rep.IraqIrelandIsraelItalyJamaicaJapanJordanKazakhstanKenyaKiribatiKorea, Dem. People’s Rep.Korea, Rep.KosovoKuwaitKyrgyz RepublicLao PDRLate-demographic dividendLatin America & Caribbean Latin America & Caribbean (excluding high income)Latin America & the Caribbean (IDA & IBRD countries)LatviaLeast developed countries: UN classificationLebanonLiberiaLibyaLithuaniaLow & middle incomeLow incomeLower middle incomeLuxembourgMacao SAR, ChinaMacedonia, FYRMadagascarMalawiMalaysiaMaldivesMaliMaltaMauritaniaMauritiusMexicoMiddle East & North AfricaMiddle East & North Africa (excluding high income)Middle East & North Africa (IDA & IBRD countries)Middle incomeMoldovaMongoliaMontenegroMoroccoMozambiqueMyanmarNauruNepalNetherlandsNew CaledoniaNew ZealandNicaraguaNigerNigeriaNorth AmericaNorwayOECD membersOmanOther small statesPacific island small statesPakistanPanamaPapua New GuineaParaguayPeruPhilippinesPolandPortugalPost-demographic dividendPre-demographic dividendQatarRomaniaRussian FederationRwandaSamoaSao Tome and PrincipeSaudi ArabiaSenegalSerbiaSeychellesSierra LeoneSingaporeSlovak RepublicSloveniaSmall statesSolomon IslandsSomaliaSouth AfricaSouth AsiaSouth Asia (IDA & IBRD)SpainSri LankaSt. Kitts and NevisSt. LuciaSt. Vincent and the GrenadinesSub-Saharan Africa Sub-Saharan Africa (excluding high income)Sub-Saharan Africa (IDA & IBRD countries)SudanSurinameSwedenSwitzerlandSyrian Arab RepublicTajikistanTanzaniaThailandTogoTongaTrinidad and TobagoTunisiaTurkeyTurkmenistanTuvaluUgandaUkraineUnited Arab EmiratesUnited KingdomUnited StatesUpper middle incomeUruguayUzbekistanVanuatuVenezuela, RBVietnamWorldYemen, Rep.ZambiaZimbabwe Timeline:
This timeline shows a graph from 1961 to 2015 of United States. No data until 1960. Number of actual observations by date: 55.
Source name:
World Development Indicators
Source organization:
World Bank staff estimates based data from International Monetary Fund's Direction of Trade database.
Categories, topics:
Private Sector, Trade
Last updated:
apr 23, 2017
Indicators value changes by year
Minimum:
15.739 bln
jan 1, 1962
Maximum:
2.348 trl
jan 1, 2015
At the date of observation
Value
Absolute change
Change from previous value
jan 1, 1961
16.171 bln
+16.171 bln
0.0%
jan 1, 1962
15.739 bln
-432.1 mln
-2.67%
jan 1, 1963
17.523 bln
+1.784 bln
11.34%
jan 1, 1964
18.377 bln
+854.0 mln
4.87%
jan 1, 1965
20.081 bln
+1.704 bln
9.27%
jan 1, 1966
22.916 bln
+2.835 bln
14.12%
jan 1, 1967
27.735 bln
+4.819 bln
21.03%
jan 1, 1968
28.754 bln
+1.019 bln
3.67%
jan 1, 1969
35.368 bln
+6.614 bln
23.0%
jan 1, 1970
38.409 bln
+3.041 bln
8.6%
jan 1, 1971
42.7 bln
+4.291 bln
11.17%
jan 1, 1972
48.749 bln
+6.05 bln
14.17%
jan 1, 1973
59.343 bln
+10.594 bln
21.73%
jan 1, 1974
74.297 bln
+14.954 bln
25.2%
jan 1, 1975
110.112 bln
+35.816 bln
48.21%
jan 1, 1976
105.521 bln
-4.591 bln
-4.17%
jan 1, 1977
132.227 bln
+26.706 bln
25.31%
jan 1, 1978
160.447 bln
+28.22 bln
21.34%
jan 1, 1979
186.072 bln
+25.625 bln
15.97%
jan 1, 1980
222.407 bln
+36.335 bln
19.53%
jan 1, 1981
257.098 bln
+34.691 bln
15.6%
jan 1, 1982
273.481 bln
+16.383 bln
6.37%
jan 1, 1983
254.934 bln
-18.547 bln
-6.78%
jan 1, 1984
269.944 bln
+15.011 bln
5.89%
jan 1, 1985
341.241 bln
+71.296 bln
26.41%
jan 1, 1986
361.692 bln
+20.451 bln
5.99%
jan 1, 1987
387.136 bln
+25.445 bln
7.03%
jan 1, 1988
424.125 bln
+36.988 bln
9.55%
jan 1, 1989
459.797 bln
+35.673 bln
8.41%
jan 1, 1990
493.351 bln
+33.554 bln
7.3%
jan 1, 1991
517.019 bln
+23.668 bln
4.8%
jan 1, 1992
509.32 bln
-7.699 bln
-1.49%
jan 1, 1993
552.613 bln
+43.294 bln
8.5%
jan 1, 1994
603.009 bln
+50.396 bln
9.12%
jan 1, 1995
689.371 bln
+86.362 bln
14.32%
jan 1, 1996
771.093 bln
+81.722 bln
11.85%
jan 1, 1997
817.854 bln
+46.761 bln
6.06%
jan 1, 1998
898.713 bln
+80.859 bln
9.89%
jan 1, 1999
944.693 bln
+45.98 bln
5.12%
jan 1, 2000
1.048 trl
+103.79 bln
10.99%
jan 1, 2001
1.238 trl
+189.765 bln
18.1%
jan 1, 2002
1.18 trl
-58.077 bln
-4.69%
jan 1, 2003
1.202 trl
+22.244 bln
1.88%
jan 1, 2004
1.305 trl
+102.897 bln
8.56%
jan 1, 2005
1.525 trl
+220.161 bln
16.87%
jan 1, 2006
1.733 trl
+207.047 bln
13.57%
jan 1, 2007
1.919 trl
+186.721 bln
10.78%
jan 1, 2008
2.017 trl
+98.14 bln
5.11%
jan 1, 2009
2.166 trl
+148.601 bln
7.37%
jan 1, 2010
1.604 trl
-562.432 bln
-25.97%
jan 1, 2011
1.968 trl
+364.566 bln
22.73%
jan 1, 2012
2.208 trl
+239.832 bln
12.19%
jan 1, 2013
2.276 trl
+68.313 bln
3.09%
jan 1, 2014
2.268 trl
-7.89 bln
-0.35%
jan 1, 2015
2.348 trl
+79.31 bln
3.5%
Ranking of countries by current statistics by years


Comments: