29
/
en
AIzaSyAYiBZKx7MnpbEhh9jyipgxe19OcubqV5w
April 1, 2024
148210
Guyana
GUY
true
2
1
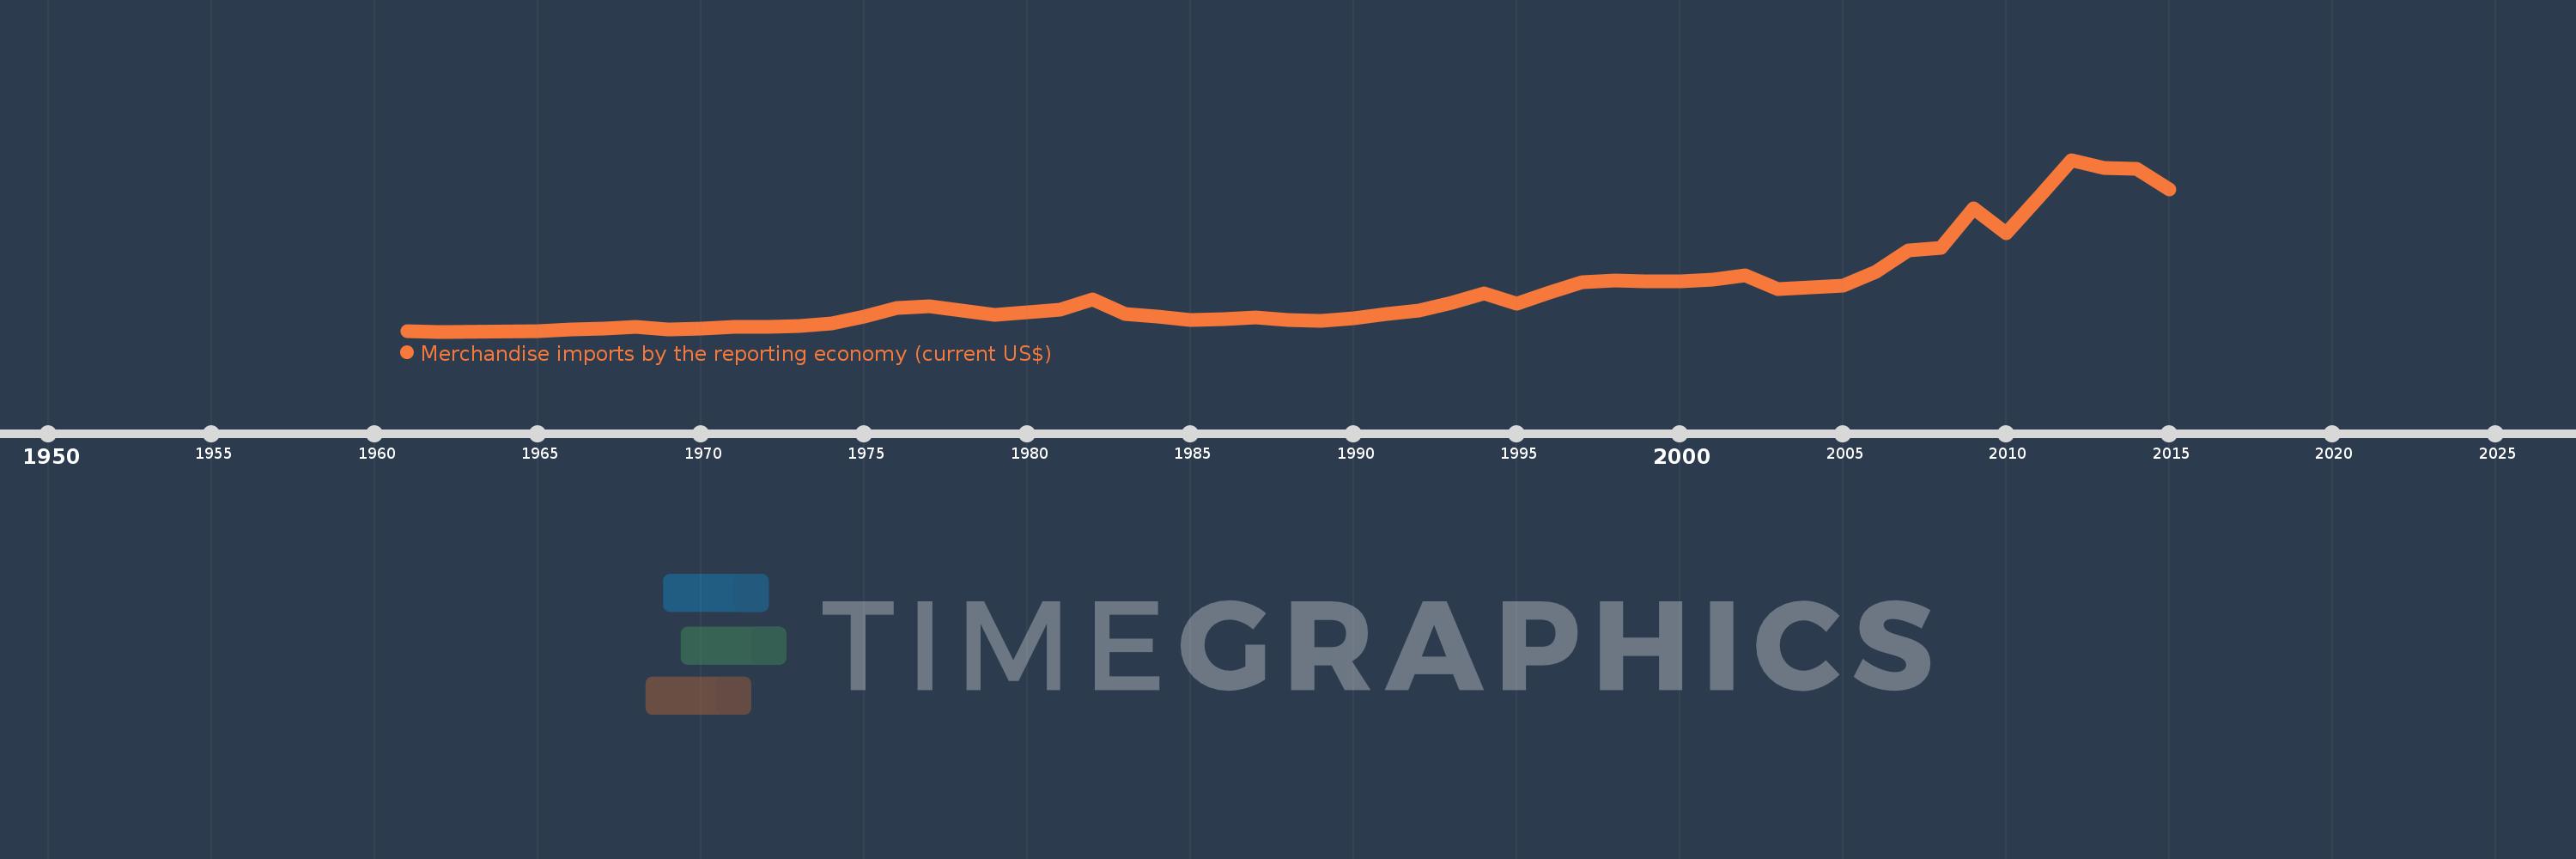
Merchandise imports by the reporting economy (current US$)
2015,2014,2013,2012,2011,2010,2009,2008,2007,2006,2005,2004,2003,2002,2001,2000,1999,1998,1997,1996,1995,1994,1993,1992,1991,1990,1989,1988,1987,1986,1985,1984,1983,1982,1981,1980,1979,1978,1977,1976,1975,1974,1973,1972,1971,1970,1969,1968,1967,1966,1965,1962,1961
This statistics in other country:
AfghanistanAlbaniaAlgeriaAmerican SamoaAngolaAntigua and BarbudaArab WorldArgentinaArmeniaArubaAustraliaAustriaAzerbaijanBahamas, TheBahrainBangladeshBarbadosBelarusBelgiumBelizeBeninBermudaBoliviaBosnia and HerzegovinaBrazilBrunei DarussalamBulgariaBurkina FasoBurundiCabo VerdeCambodiaCameroonCanadaCaribbean small statesCentral African RepublicCentral Europe and the BalticsChadChileChinaColombiaComorosCongo, Dem. Rep.Congo, Rep.Costa RicaCote d'IvoireCroatiaCubaCyprusCzech RepublicDenmarkDjiboutiDominicaDominican RepublicEarly-demographic dividendEast Asia & PacificEast Asia & Pacific (excluding high income)East Asia & Pacific (IDA & IBRD countries)EcuadorEgypt, Arab Rep.El SalvadorEquatorial GuineaEstoniaEthiopiaEuro areaEurope & Central AsiaEurope & Central Asia (excluding high income)Europe & Central Asia (IDA & IBRD countries)European UnionFaroe IslandsFijiFinlandFragile and conflict affected situationsFranceFrench PolynesiaGabonGambia, TheGeorgiaGermanyGhanaGibraltarGreeceGreenlandGrenadaGuamGuatemalaGuineaGuinea-BissauGuyanaHaitiHeavily indebted poor countries (HIPC)High incomeHondurasHong Kong SAR, ChinaHungaryIBRD onlyIcelandIDA & IBRD totalIDA blendIDA onlyIDA totalIndiaIndonesiaIran, Islamic Rep.IraqIrelandIsraelItalyJamaicaJapanJordanKazakhstanKenyaKiribatiKorea, Dem. People’s Rep.Korea, Rep.KosovoKuwaitKyrgyz RepublicLao PDRLate-demographic dividendLatin America & Caribbean Latin America & Caribbean (excluding high income)Latin America & the Caribbean (IDA & IBRD countries)LatviaLeast developed countries: UN classificationLebanonLiberiaLibyaLithuaniaLow & middle incomeLow incomeLower middle incomeLuxembourgMacao SAR, ChinaMacedonia, FYRMadagascarMalawiMalaysiaMaldivesMaliMaltaMauritaniaMauritiusMexicoMiddle East & North AfricaMiddle East & North Africa (excluding high income)Middle East & North Africa (IDA & IBRD countries)Middle incomeMoldovaMongoliaMontenegroMoroccoMozambiqueMyanmarNauruNepalNetherlandsNew CaledoniaNew ZealandNicaraguaNigerNigeriaNorth AmericaNorwayOECD membersOmanOther small statesPacific island small statesPakistanPanamaPapua New GuineaParaguayPeruPhilippinesPolandPortugalPost-demographic dividendPre-demographic dividendQatarRomaniaRussian FederationRwandaSamoaSao Tome and PrincipeSaudi ArabiaSenegalSerbiaSeychellesSierra LeoneSingaporeSlovak RepublicSloveniaSmall statesSolomon IslandsSomaliaSouth AfricaSouth AsiaSouth Asia (IDA & IBRD)SpainSri LankaSt. Kitts and NevisSt. LuciaSt. Vincent and the GrenadinesSub-Saharan Africa Sub-Saharan Africa (excluding high income)Sub-Saharan Africa (IDA & IBRD countries)SudanSurinameSwedenSwitzerlandSyrian Arab RepublicTajikistanTanzaniaThailandTogoTongaTrinidad and TobagoTunisiaTurkeyTurkmenistanTuvaluUgandaUkraineUnited Arab EmiratesUnited KingdomUnited StatesUpper middle incomeUruguayUzbekistanVanuatuVenezuela, RBVietnamWorldYemen, Rep.ZambiaZimbabwe Timeline:
This timeline shows a graph from 1961 to 2015 of Guyana. No data until 1960. Number of actual observations by date: 53.
Source name:
World Development Indicators
Source organization:
World Bank staff estimates based data from International Monetary Fund's Direction of Trade database.
Categories, topics:
Private Sector, Trade
Last updated:
apr 23, 2017
Indicators value changes by year
Minimum:
85.4 mln
jan 1, 1962
Maximum:
1.969 bln
jan 1, 2012
At the date of observation
Value
Absolute change
Change from previous value
jan 1, 1961
86.1 mln
+86.1 mln
0.0%
jan 1, 1962
85.4 mln
-700.0K
-0.81%
jan 1, 1965
87.6 mln
+2.2 mln
2.58%
jan 1, 1966
104.4 mln
+16.8 mln
19.18%
jan 1, 1967
117.9 mln
+13.5 mln
12.93%
jan 1, 1968
132.5 mln
+14.6 mln
12.38%
jan 1, 1969
106.1 mln
-26.4 mln
-19.92%
jan 1, 1970
118.158 mln
+12.058 mln
11.36%
jan 1, 1971
134.115 mln
+15.957 mln
13.5%
jan 1, 1972
134.041 mln
-74.0K
-0.06%
jan 1, 1973
145.999 mln
+11.958 mln
8.92%
jan 1, 1974
175.752 mln
+29.753 mln
20.38%
jan 1, 1975
253.241 mln
+77.489 mln
44.09%
jan 1, 1976
342.371 mln
+89.13 mln
35.2%
jan 1, 1977
363.679 mln
+21.308 mln
6.22%
jan 1, 1978
314.021 mln
-49.658 mln
-13.65%
jan 1, 1979
269.304 mln
-44.717 mln
-14.24%
jan 1, 1980
292.712 mln
+23.408 mln
8.69%
jan 1, 1981
321.079 mln
+28.367 mln
9.69%
jan 1, 1982
439.638 mln
+118.559 mln
36.93%
jan 1, 1983
280.146 mln
-159.492 mln
-36.28%
jan 1, 1984
251.729 mln
-28.417 mln
-10.14%
jan 1, 1985
211.988 mln
-39.741 mln
-15.79%
jan 1, 1986
225.44 mln
+13.452 mln
6.35%
jan 1, 1987
242.486 mln
+17.046 mln
7.56%
jan 1, 1988
215.462 mln
-27.024 mln
-11.14%
jan 1, 1989
206.237 mln
-9.225 mln
-4.28%
jan 1, 1990
230.788 mln
+24.551 mln
11.9%
jan 1, 1991
279.172 mln
+48.385 mln
20.97%
jan 1, 1992
311.925 mln
+32.753 mln
11.73%
jan 1, 1993
400.008 mln
+88.083 mln
28.24%
jan 1, 1994
506.834 mln
+106.826 mln
26.71%
jan 1, 1995
394.585 mln
-112.249 mln
-22.15%
jan 1, 1996
517.286 mln
+122.701 mln
31.1%
jan 1, 1997
622.246 mln
+104.959 mln
20.29%
jan 1, 1998
647.818 mln
+25.573 mln
4.11%
jan 1, 1999
635.352 mln
-12.466 mln
-1.92%
jan 1, 2000
638.376 mln
+3.024 mln
0.48%
jan 1, 2001
651.024 mln
+12.648 mln
1.98%
jan 1, 2002
700.104 mln
+49.08 mln
7.54%
jan 1, 2003
555.479 mln
-144.625 mln
-20.66%
jan 1, 2004
571.166 mln
+15.687 mln
2.82%
jan 1, 2005
593.434 mln
+22.268 mln
3.9%
jan 1, 2006
738.054 mln
+144.619 mln
24.37%
jan 1, 2007
970.926 mln
+232.873 mln
31.55%
jan 1, 2008
1.002 bln
+31.414 mln
3.24%
jan 1, 2009
1.432 bln
+429.893 mln
42.89%
jan 1, 2010
1.161 bln
-271.428 mln
-18.95%
jan 1, 2011
1.558 bln
+397.637 mln
34.26%
jan 1, 2012
1.969 bln
+410.561 mln
26.34%
jan 1, 2013
1.881 bln
-87.759 mln
-4.46%
jan 1, 2014
1.866 bln
-15.032 mln
-0.8%
jan 1, 2015
1.641 bln
-225.454 mln
-12.08%
Ranking of countries by current statistics by years


Comments: