29
/
en
AIzaSyAYiBZKx7MnpbEhh9jyipgxe19OcubqV5w
April 1, 2024
31823
Europe & Central Asia (excluding high income)
ECA
false
2
1
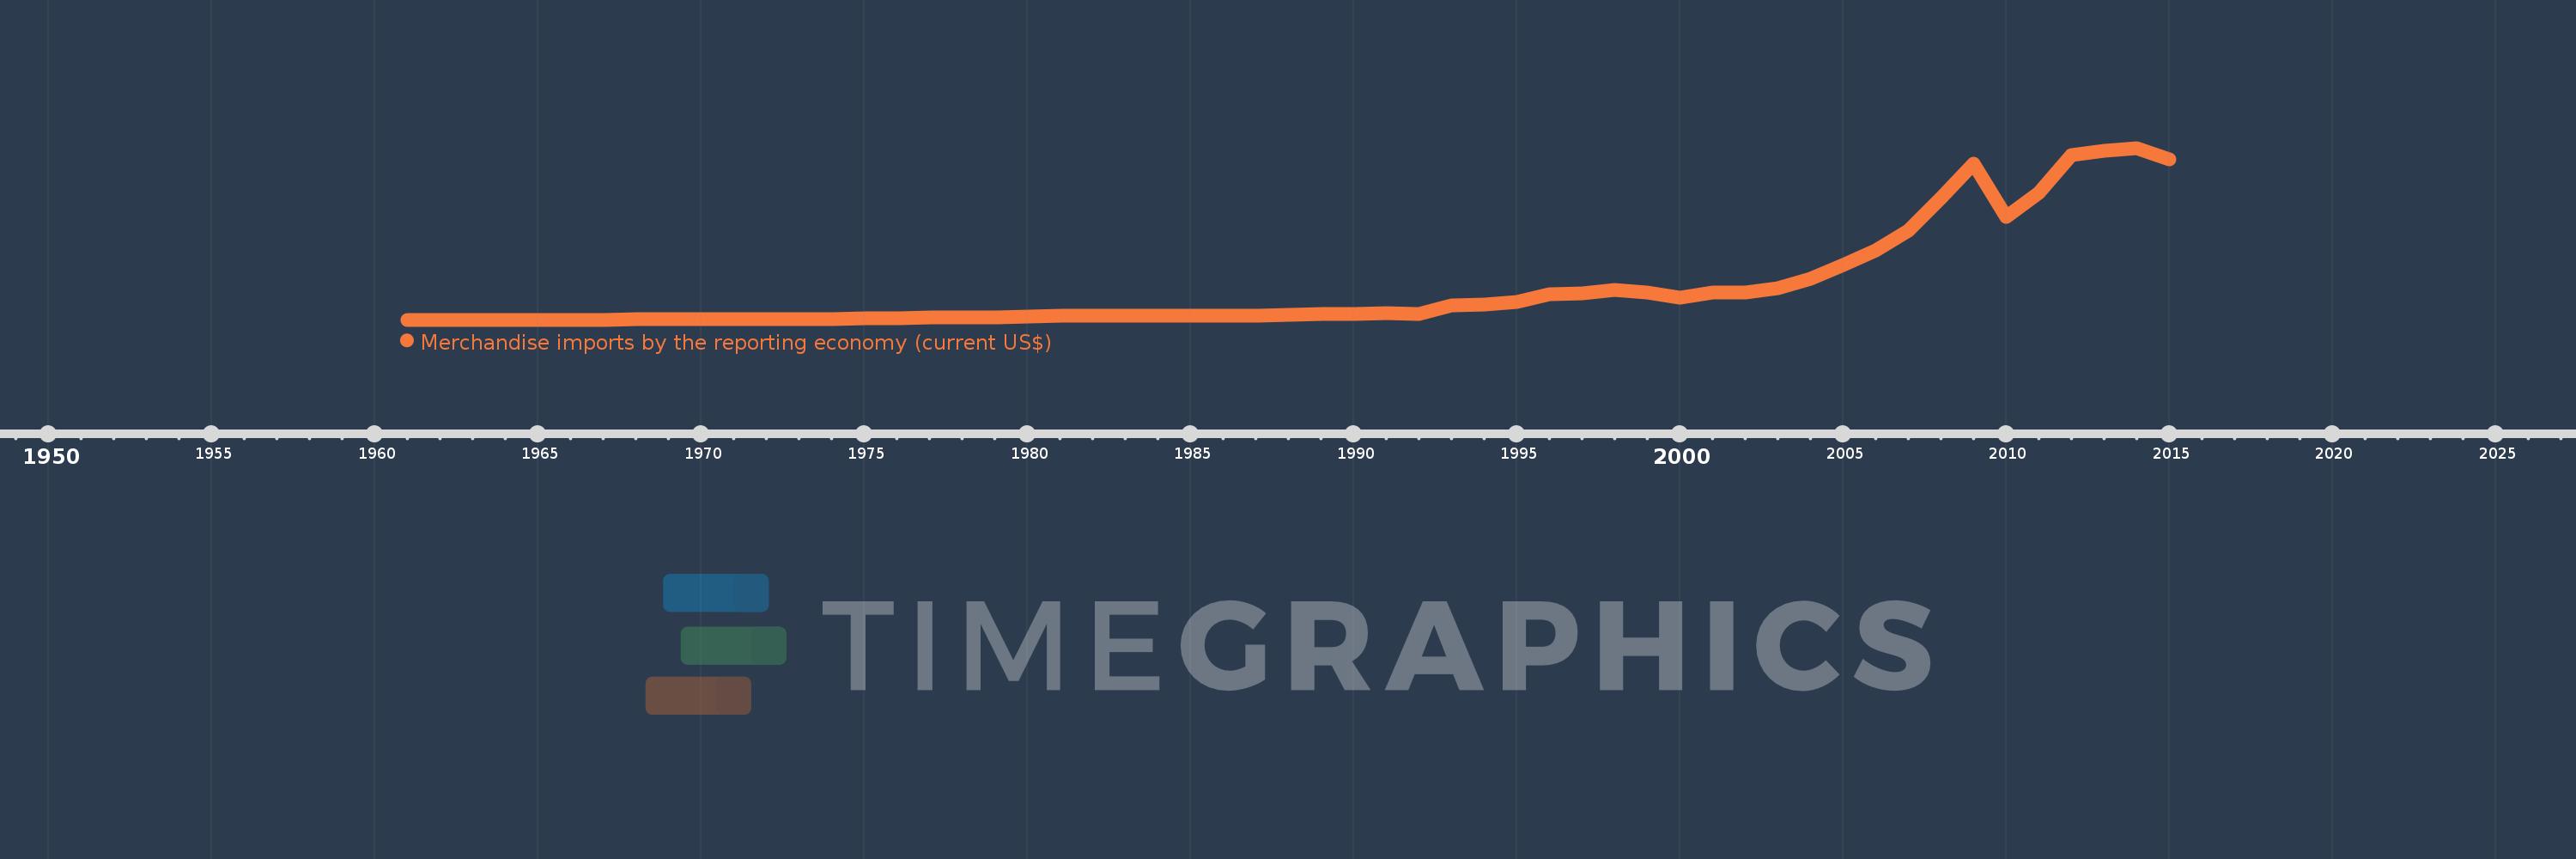
Merchandise imports by the reporting economy (current US$)
2015,2014,2013,2012,2011,2010,2009,2008,2007,2006,2005,2004,2003,2002,2001,2000,1999,1998,1997,1996,1995,1994,1993,1992,1991,1990,1989,1988,1987,1986,1985,1984,1983,1982,1981,1980,1979,1978,1977,1976,1975,1974,1973,1972,1971,1970,1969,1968,1967,1966,1965,1964,1963,1962,1961
This statistics in other country:
AfghanistanAlbaniaAlgeriaAmerican SamoaAngolaAntigua and BarbudaArab WorldArgentinaArmeniaArubaAustraliaAustriaAzerbaijanBahamas, TheBahrainBangladeshBarbadosBelarusBelgiumBelizeBeninBermudaBoliviaBosnia and HerzegovinaBrazilBrunei DarussalamBulgariaBurkina FasoBurundiCabo VerdeCambodiaCameroonCanadaCaribbean small statesCentral African RepublicCentral Europe and the BalticsChadChileChinaColombiaComorosCongo, Dem. Rep.Congo, Rep.Costa RicaCote d'IvoireCroatiaCubaCyprusCzech RepublicDenmarkDjiboutiDominicaDominican RepublicEarly-demographic dividendEast Asia & PacificEast Asia & Pacific (excluding high income)East Asia & Pacific (IDA & IBRD countries)EcuadorEgypt, Arab Rep.El SalvadorEquatorial GuineaEstoniaEthiopiaEuro areaEurope & Central AsiaEurope & Central Asia (excluding high income)Europe & Central Asia (IDA & IBRD countries)European UnionFaroe IslandsFijiFinlandFragile and conflict affected situationsFranceFrench PolynesiaGabonGambia, TheGeorgiaGermanyGhanaGibraltarGreeceGreenlandGrenadaGuamGuatemalaGuineaGuinea-BissauGuyanaHaitiHeavily indebted poor countries (HIPC)High incomeHondurasHong Kong SAR, ChinaHungaryIBRD onlyIcelandIDA & IBRD totalIDA blendIDA onlyIDA totalIndiaIndonesiaIran, Islamic Rep.IraqIrelandIsraelItalyJamaicaJapanJordanKazakhstanKenyaKiribatiKorea, Dem. People’s Rep.Korea, Rep.KosovoKuwaitKyrgyz RepublicLao PDRLate-demographic dividendLatin America & Caribbean Latin America & Caribbean (excluding high income)Latin America & the Caribbean (IDA & IBRD countries)LatviaLeast developed countries: UN classificationLebanonLiberiaLibyaLithuaniaLow & middle incomeLow incomeLower middle incomeLuxembourgMacao SAR, ChinaMacedonia, FYRMadagascarMalawiMalaysiaMaldivesMaliMaltaMauritaniaMauritiusMexicoMiddle East & North AfricaMiddle East & North Africa (excluding high income)Middle East & North Africa (IDA & IBRD countries)Middle incomeMoldovaMongoliaMontenegroMoroccoMozambiqueMyanmarNauruNepalNetherlandsNew CaledoniaNew ZealandNicaraguaNigerNigeriaNorth AmericaNorwayOECD membersOmanOther small statesPacific island small statesPakistanPanamaPapua New GuineaParaguayPeruPhilippinesPolandPortugalPost-demographic dividendPre-demographic dividendQatarRomaniaRussian FederationRwandaSamoaSao Tome and PrincipeSaudi ArabiaSenegalSerbiaSeychellesSierra LeoneSingaporeSlovak RepublicSloveniaSmall statesSolomon IslandsSomaliaSouth AfricaSouth AsiaSouth Asia (IDA & IBRD)SpainSri LankaSt. Kitts and NevisSt. LuciaSt. Vincent and the GrenadinesSub-Saharan Africa Sub-Saharan Africa (excluding high income)Sub-Saharan Africa (IDA & IBRD countries)SudanSurinameSwedenSwitzerlandSyrian Arab RepublicTajikistanTanzaniaThailandTogoTongaTrinidad and TobagoTunisiaTurkeyTurkmenistanTuvaluUgandaUkraineUnited Arab EmiratesUnited KingdomUnited StatesUpper middle incomeUruguayUzbekistanVanuatuVenezuela, RBVietnamWorldYemen, Rep.ZambiaZimbabwe Timeline:
This timeline shows a graph from 1961 to 2015 of Europe & Central Asia (excluding high income). No data until 1960. Number of actual observations by date: 55.
Source name:
World Development Indicators
Source organization:
World Bank staff estimates based data from International Monetary Fund's Direction of Trade database.
Categories, topics:
Private Sector, Trade
Last updated:
apr 23, 2017
Indicators value changes by year
Minimum:
1.179 bln
jan 1, 1961
Maximum:
936.119 bln
jan 1, 2014
At the date of observation
Value
Absolute change
Change from previous value
jan 1, 1961
1.179 bln
+1.179 bln
0.0%
jan 1, 1962
1.402 bln
+223.34 mln
18.94%
jan 1, 1963
1.652 bln
+249.57 mln
17.8%
jan 1, 1964
1.809 bln
+156.83 mln
9.49%
jan 1, 1965
1.824 bln
+15.42 mln
0.85%
jan 1, 1966
1.758 bln
-65.76 mln
-3.6%
jan 1, 1967
2.059 bln
+300.54 mln
17.09%
jan 1, 1968
2.392 bln
+332.61 mln
16.15%
jan 1, 1969
2.54 bln
+148.94 mln
6.23%
jan 1, 1970
2.671 bln
+130.75 mln
5.15%
jan 1, 1971
3.045 bln
+373.8 mln
13.99%
jan 1, 1972
3.399 bln
+354.01 mln
11.63%
jan 1, 1973
4.399 bln
+1.0 bln
29.43%
jan 1, 1974
5.916 bln
+1.516 bln
34.47%
jan 1, 1975
9.431 bln
+3.515 bln
59.42%
jan 1, 1976
10.611 bln
+1.18 bln
12.51%
jan 1, 1977
11.835 bln
+1.223 bln
11.53%
jan 1, 1978
13.516 bln
+1.682 bln
14.21%
jan 1, 1979
14.401 bln
+884.59 mln
6.54%
jan 1, 1980
17.073 bln
+2.672 bln
18.55%
jan 1, 1981
22.188 bln
+5.115 bln
29.96%
jan 1, 1982
24.647 bln
+2.459 bln
11.08%
jan 1, 1983
21.246 bln
-3.402 bln
-13.8%
jan 1, 1984
20.817 bln
-428.153 mln
-2.02%
jan 1, 1985
22.5 bln
+1.682 bln
8.08%
jan 1, 1986
25.297 bln
+2.798 bln
12.44%
jan 1, 1987
24.979 bln
-318.354 mln
-1.26%
jan 1, 1988
29.988 bln
+5.009 bln
20.05%
jan 1, 1989
30.288 bln
+299.965 mln
1.0%
jan 1, 1990
31.417 bln
+1.129 bln
3.73%
jan 1, 1991
37.325 bln
+5.908 bln
18.81%
jan 1, 1992
30.3 bln
-7.025 bln
-18.82%
jan 1, 1993
78.9 bln
+48.6 bln
160.39%
jan 1, 1994
81.747 bln
+2.847 bln
3.61%
jan 1, 1995
99.985 bln
+18.237 bln
22.31%
jan 1, 1996
138.912 bln
+38.927 bln
38.93%
jan 1, 1997
146.285 bln
+7.373 bln
5.31%
jan 1, 1998
161.93 bln
+15.645 bln
10.7%
jan 1, 1999
148.359 bln
-13.571 bln
-8.38%
jan 1, 2000
122.862 bln
-25.497 bln
-17.19%
jan 1, 2001
149.924 bln
+27.062 bln
22.03%
jan 1, 2002
147.076 bln
-2.848 bln
-1.9%
jan 1, 2003
172.245 bln
+25.169 bln
17.11%
jan 1, 2004
225.884 bln
+53.639 bln
31.14%
jan 1, 2005
298.108 bln
+72.224 bln
31.97%
jan 1, 2006
376.824 bln
+78.716 bln
26.41%
jan 1, 2007
486.113 bln
+109.289 bln
29.0%
jan 1, 2008
664.06 bln
+177.946 bln
36.61%
jan 1, 2009
848.55 bln
+184.49 bln
27.78%
jan 1, 2010
561.454 bln
-287.096 bln
-33.83%
jan 1, 2011
690.557 bln
+129.103 bln
22.99%
jan 1, 2012
896.516 bln
+205.96 bln
29.83%
jan 1, 2013
918.923 bln
+22.407 bln
2.5%
jan 1, 2014
936.119 bln
+17.196 bln
1.87%
jan 1, 2015
875.468 bln
-60.651 bln
-6.48%
Ranking of countries by current statistics by years


Comments: