29
/
en
AIzaSyAYiBZKx7MnpbEhh9jyipgxe19OcubqV5w
April 1, 2024
52051
North America
NAC
false
2
1
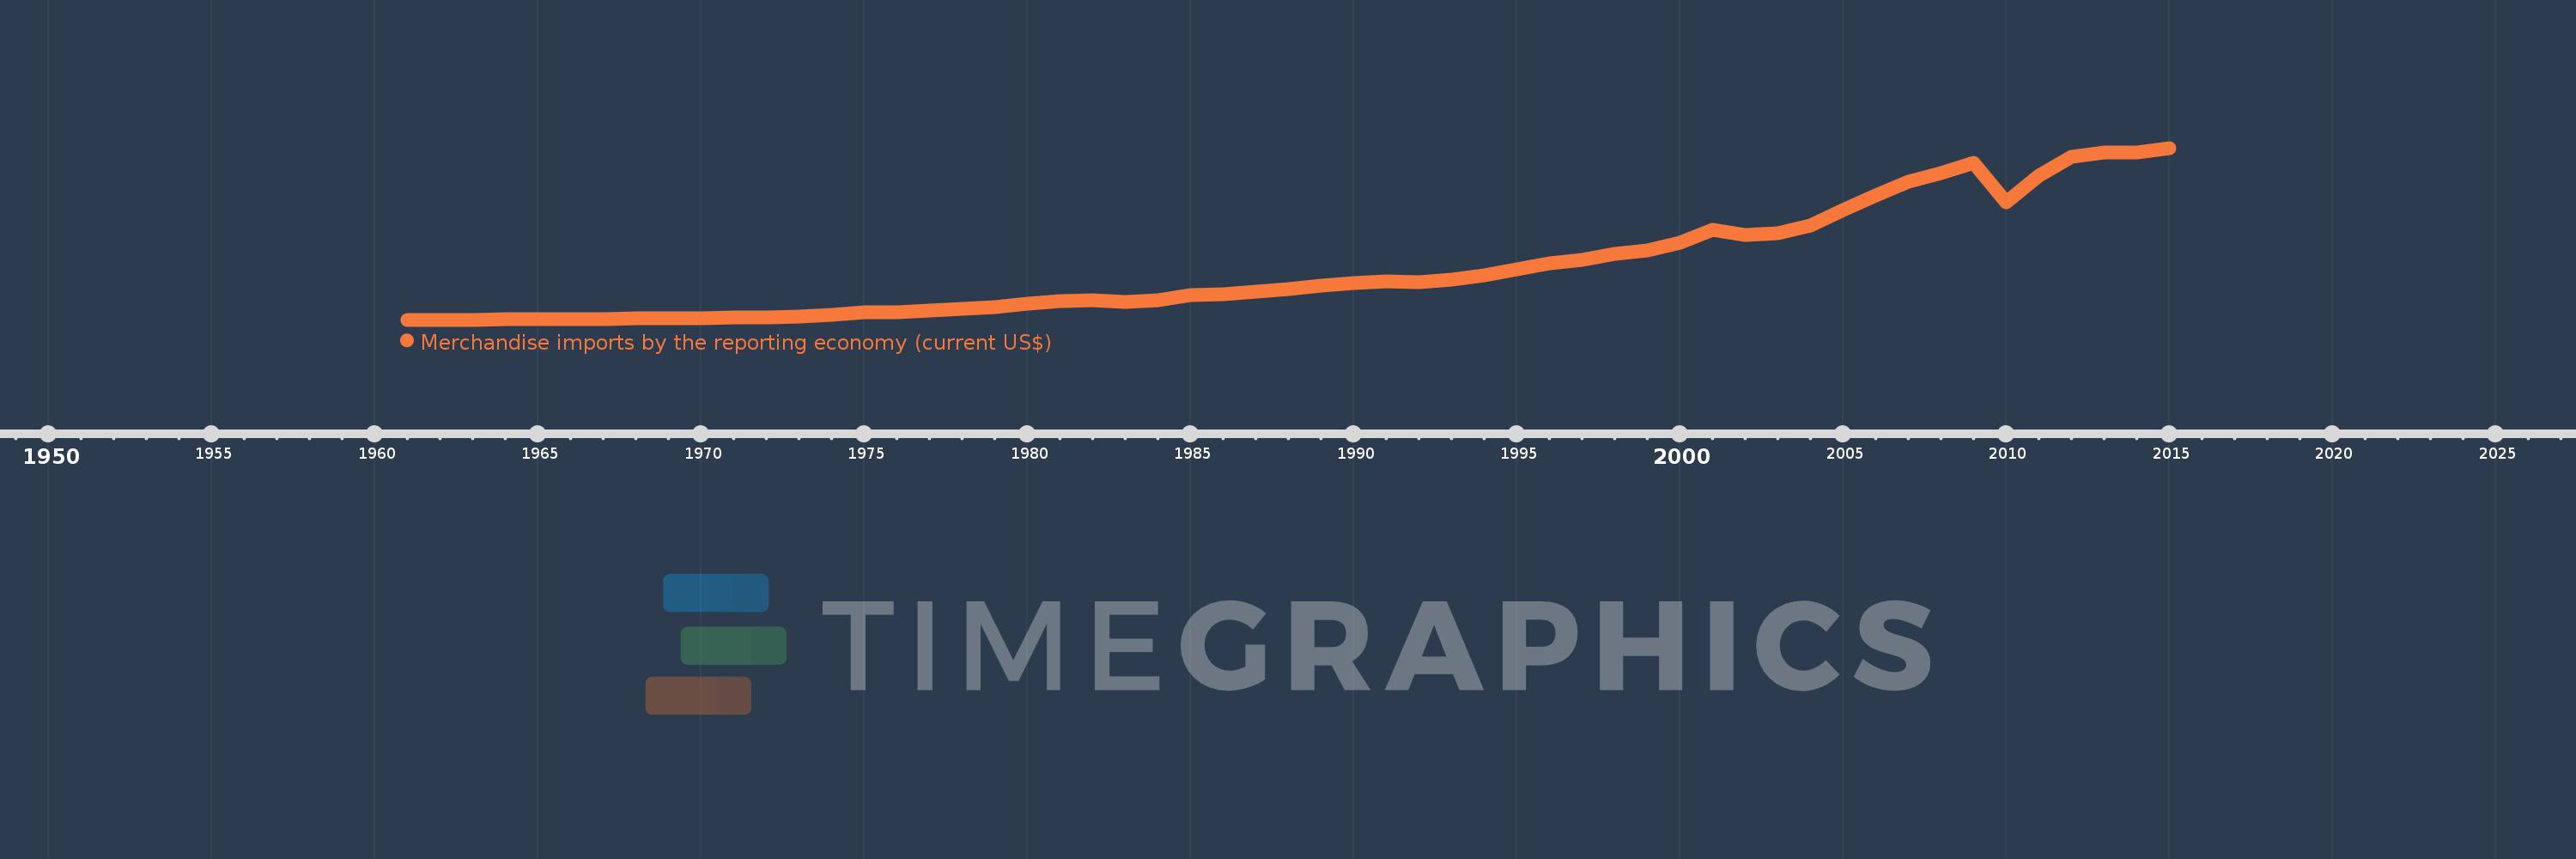
Merchandise imports by the reporting economy (current US$)
2015,2014,2013,2012,2011,2010,2009,2008,2007,2006,2005,2004,2003,2002,2001,2000,1999,1998,1997,1996,1995,1994,1993,1992,1991,1990,1989,1988,1987,1986,1985,1984,1983,1982,1981,1980,1979,1978,1977,1976,1975,1974,1973,1972,1971,1970,1969,1968,1967,1966,1965,1964,1963,1962,1961
This statistics in other country:
AfghanistanAlbaniaAlgeriaAmerican SamoaAngolaAntigua and BarbudaArab WorldArgentinaArmeniaArubaAustraliaAustriaAzerbaijanBahamas, TheBahrainBangladeshBarbadosBelarusBelgiumBelizeBeninBermudaBoliviaBosnia and HerzegovinaBrazilBrunei DarussalamBulgariaBurkina FasoBurundiCabo VerdeCambodiaCameroonCanadaCaribbean small statesCentral African RepublicCentral Europe and the BalticsChadChileChinaColombiaComorosCongo, Dem. Rep.Congo, Rep.Costa RicaCote d'IvoireCroatiaCubaCyprusCzech RepublicDenmarkDjiboutiDominicaDominican RepublicEarly-demographic dividendEast Asia & PacificEast Asia & Pacific (excluding high income)East Asia & Pacific (IDA & IBRD countries)EcuadorEgypt, Arab Rep.El SalvadorEquatorial GuineaEstoniaEthiopiaEuro areaEurope & Central AsiaEurope & Central Asia (excluding high income)Europe & Central Asia (IDA & IBRD countries)European UnionFaroe IslandsFijiFinlandFragile and conflict affected situationsFranceFrench PolynesiaGabonGambia, TheGeorgiaGermanyGhanaGibraltarGreeceGreenlandGrenadaGuamGuatemalaGuineaGuinea-BissauGuyanaHaitiHeavily indebted poor countries (HIPC)High incomeHondurasHong Kong SAR, ChinaHungaryIBRD onlyIcelandIDA & IBRD totalIDA blendIDA onlyIDA totalIndiaIndonesiaIran, Islamic Rep.IraqIrelandIsraelItalyJamaicaJapanJordanKazakhstanKenyaKiribatiKorea, Dem. People’s Rep.Korea, Rep.KosovoKuwaitKyrgyz RepublicLao PDRLate-demographic dividendLatin America & Caribbean Latin America & Caribbean (excluding high income)Latin America & the Caribbean (IDA & IBRD countries)LatviaLeast developed countries: UN classificationLebanonLiberiaLibyaLithuaniaLow & middle incomeLow incomeLower middle incomeLuxembourgMacao SAR, ChinaMacedonia, FYRMadagascarMalawiMalaysiaMaldivesMaliMaltaMauritaniaMauritiusMexicoMiddle East & North AfricaMiddle East & North Africa (excluding high income)Middle East & North Africa (IDA & IBRD countries)Middle incomeMoldovaMongoliaMontenegroMoroccoMozambiqueMyanmarNauruNepalNetherlandsNew CaledoniaNew ZealandNicaraguaNigerNigeriaNorth AmericaNorwayOECD membersOmanOther small statesPacific island small statesPakistanPanamaPapua New GuineaParaguayPeruPhilippinesPolandPortugalPost-demographic dividendPre-demographic dividendQatarRomaniaRussian FederationRwandaSamoaSao Tome and PrincipeSaudi ArabiaSenegalSerbiaSeychellesSierra LeoneSingaporeSlovak RepublicSloveniaSmall statesSolomon IslandsSomaliaSouth AfricaSouth AsiaSouth Asia (IDA & IBRD)SpainSri LankaSt. Kitts and NevisSt. LuciaSt. Vincent and the GrenadinesSub-Saharan Africa Sub-Saharan Africa (excluding high income)Sub-Saharan Africa (IDA & IBRD countries)SudanSurinameSwedenSwitzerlandSyrian Arab RepublicTajikistanTanzaniaThailandTogoTongaTrinidad and TobagoTunisiaTurkeyTurkmenistanTuvaluUgandaUkraineUnited Arab EmiratesUnited KingdomUnited StatesUpper middle incomeUruguayUzbekistanVanuatuVenezuela, RBVietnamWorldYemen, Rep.ZambiaZimbabwe Timeline:
This timeline shows a graph from 1961 to 2015 of North America. No data until 1960. Number of actual observations by date: 55.
Source name:
World Development Indicators
Source organization:
World Bank staff estimates based data from International Monetary Fund's Direction of Trade database.
Categories, topics:
Private Sector, Trade
Last updated:
apr 23, 2017
Indicators value changes by year
Minimum:
22.246 bln
jan 1, 1962
Maximum:
2.859 trl
jan 1, 2015
At the date of observation
Value
Absolute change
Change from previous value
jan 1, 1961
22.639 bln
+22.639 bln
0.0%
jan 1, 1962
22.246 bln
-393.0 mln
-1.74%
jan 1, 1963
24.183 bln
+1.938 bln
8.71%
jan 1, 1964
25.269 bln
+1.085 bln
4.49%
jan 1, 1965
27.996 bln
+2.728 bln
10.79%
jan 1, 1966
32.132 bln
+4.135 bln
14.77%
jan 1, 1967
38.523 bln
+6.391 bln
19.89%
jan 1, 1968
40.365 bln
+1.843 bln
4.78%
jan 1, 1969
48.484 bln
+8.119 bln
20.11%
jan 1, 1970
53.287 bln
+4.802 bln
9.9%
jan 1, 1971
57.882 bln
+4.595 bln
8.62%
jan 1, 1972
66.442 bln
+8.56 bln
14.79%
jan 1, 1973
80.818 bln
+14.376 bln
21.64%
jan 1, 1974
100.863 bln
+20.044 bln
24.8%
jan 1, 1975
147.049 bln
+46.186 bln
45.79%
jan 1, 1976
144.372 bln
-2.677 bln
-1.82%
jan 1, 1977
175.506 bln
+31.134 bln
21.56%
jan 1, 1978
205.748 bln
+30.242 bln
17.23%
jan 1, 1979
235.845 bln
+30.097 bln
14.63%
jan 1, 1980
283.501 bln
+47.656 bln
20.21%
jan 1, 1981
324.545 bln
+41.044 bln
14.48%
jan 1, 1982
348.625 bln
+24.08 bln
7.42%
jan 1, 1983
317.709 bln
-30.917 bln
-8.87%
jan 1, 1984
339.842 bln
+22.133 bln
6.97%
jan 1, 1985
425.217 bln
+85.375 bln
25.12%
jan 1, 1986
448.72 bln
+23.503 bln
5.53%
jan 1, 1987
479.267 bln
+30.547 bln
6.81%
jan 1, 1988
524.281 bln
+45.014 bln
9.39%
jan 1, 1989
581.448 bln
+57.166 bln
10.9%
jan 1, 1990
623.034 bln
+41.586 bln
7.15%
jan 1, 1991
649.255 bln
+26.221 bln
4.21%
jan 1, 1992
642.328 bln
-6.927 bln
-1.07%
jan 1, 1993
690.503 bln
+48.176 bln
7.5%
jan 1, 1994
752.004 bln
+61.5 bln
8.91%
jan 1, 1995
856.954 bln
+104.95 bln
13.96%
jan 1, 1996
951.409 bln
+94.455 bln
11.02%
jan 1, 1997
1.006 trl
+54.133 bln
5.69%
jan 1, 1998
1.115 trl
+109.504 bln
10.89%
jan 1, 1999
1.165 trl
+50.189 bln
4.5%
jan 1, 2000
1.287 trl
+122.066 bln
10.48%
jan 1, 2001
1.505 trl
+217.889 bln
16.93%
jan 1, 2002
1.429 trl
-76.433 bln
-5.08%
jan 1, 2003
1.452 trl
+23.088 bln
1.62%
jan 1, 2004
1.574 trl
+121.983 bln
8.4%
jan 1, 2005
1.829 trl
+254.937 bln
16.2%
jan 1, 2006
2.079 trl
+250.728 bln
13.71%
jan 1, 2007
2.305 trl
+225.908 bln
10.86%
jan 1, 2008
2.441 trl
+135.103 bln
5.86%
jan 1, 2009
2.62 trl
+179.52 bln
7.36%
jan 1, 2010
1.96 trl
-660.466 bln
-25.21%
jan 1, 2011
2.404 trl
+444.397 bln
22.68%
jan 1, 2012
2.709 trl
+304.717 bln
12.68%
jan 1, 2013
2.788 trl
+79.597 bln
2.94%
jan 1, 2014
2.78 trl
-8.446 bln
-0.3%
jan 1, 2015
2.859 trl
+78.863 bln
2.84%
Ranking of countries by current statistics by years


Comments: