29
/
en
AIzaSyAYiBZKx7MnpbEhh9jyipgxe19OcubqV5w
April 1, 2024
211981
Niger
NER
true
2
1
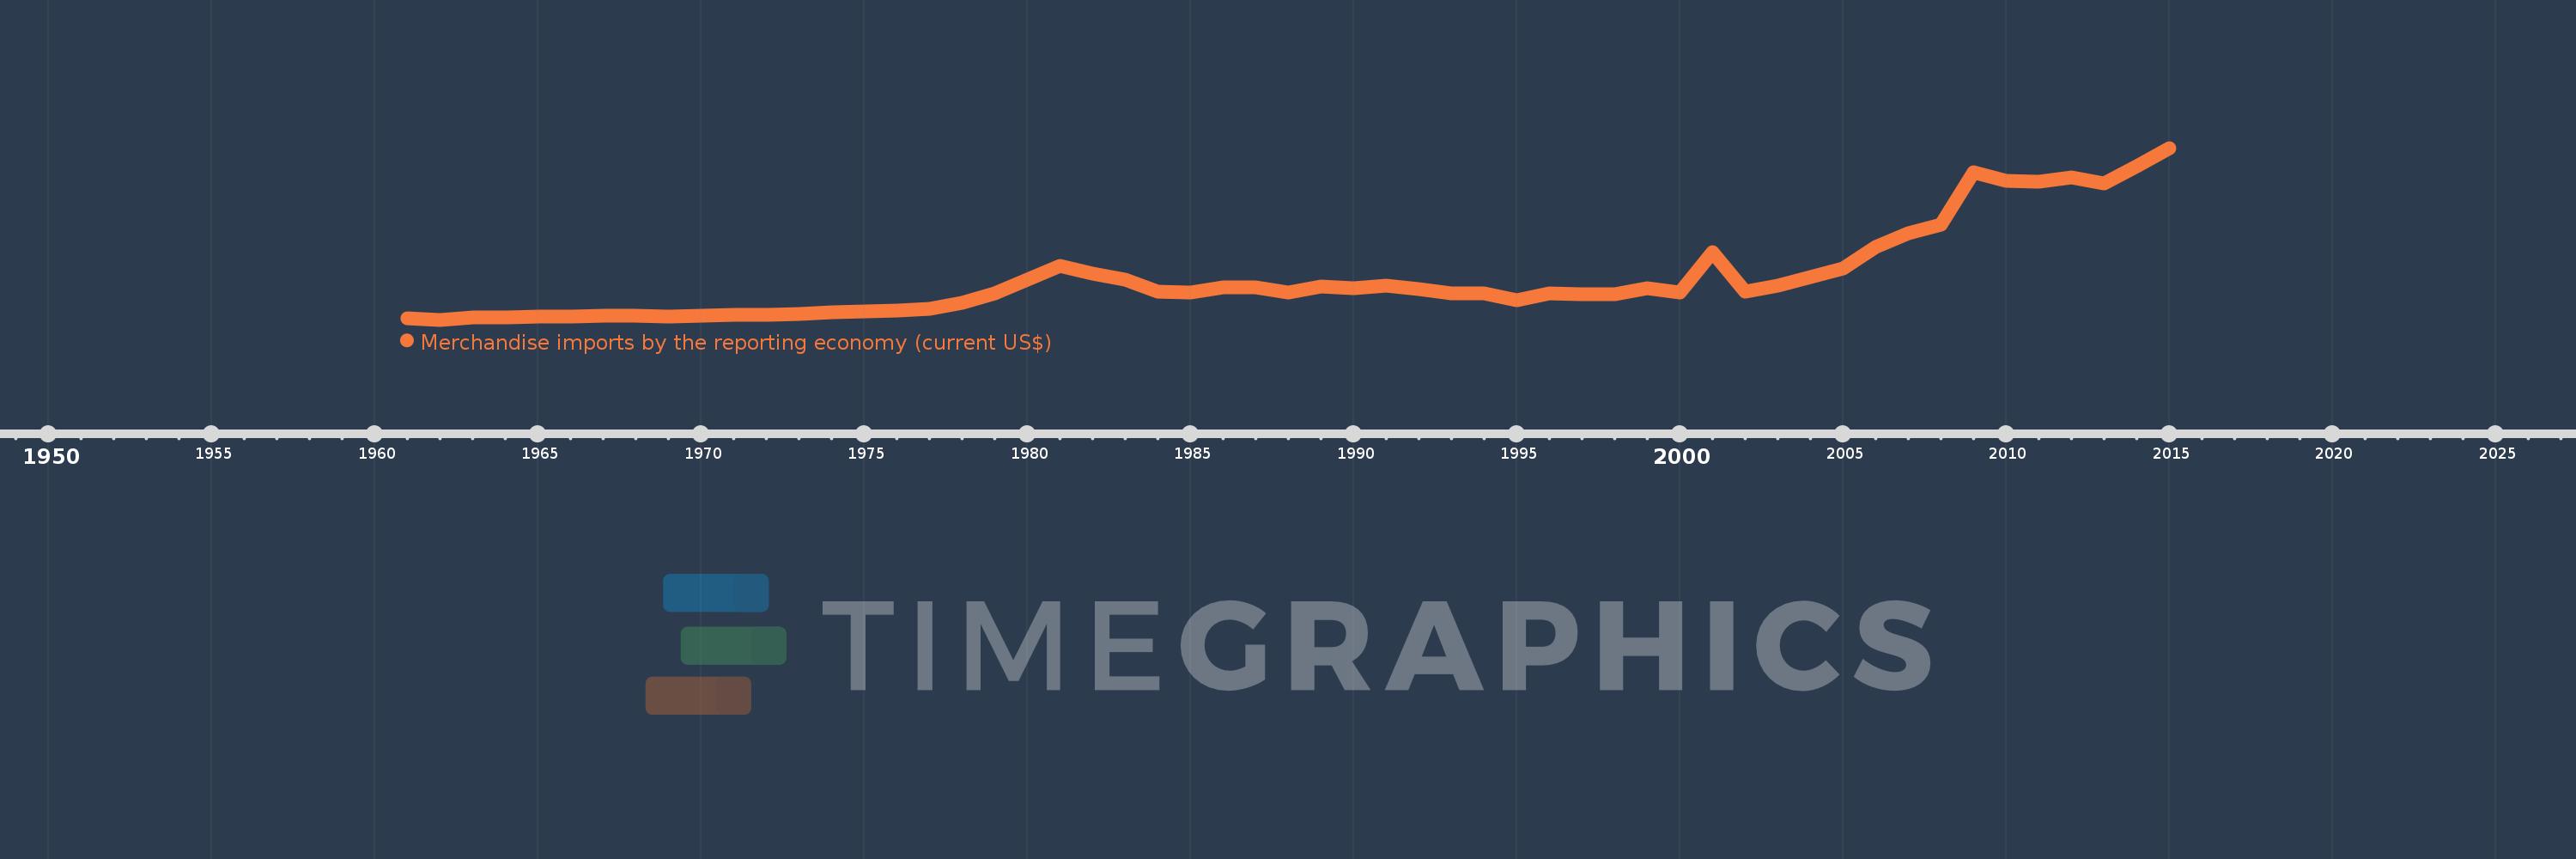
Merchandise imports by the reporting economy (current US$)
2015,2014,2013,2012,2011,2010,2009,2008,2007,2006,2005,2004,2003,2002,2001,2000,1999,1998,1997,1996,1995,1994,1993,1992,1991,1990,1989,1988,1987,1986,1985,1984,1983,1982,1981,1980,1979,1978,1977,1976,1975,1974,1973,1972,1971,1970,1969,1968,1967,1966,1965,1964,1963,1962,1961
This statistics in other country:
AfghanistanAlbaniaAlgeriaAmerican SamoaAngolaAntigua and BarbudaArab WorldArgentinaArmeniaArubaAustraliaAustriaAzerbaijanBahamas, TheBahrainBangladeshBarbadosBelarusBelgiumBelizeBeninBermudaBoliviaBosnia and HerzegovinaBrazilBrunei DarussalamBulgariaBurkina FasoBurundiCabo VerdeCambodiaCameroonCanadaCaribbean small statesCentral African RepublicCentral Europe and the BalticsChadChileChinaColombiaComorosCongo, Dem. Rep.Congo, Rep.Costa RicaCote d'IvoireCroatiaCubaCyprusCzech RepublicDenmarkDjiboutiDominicaDominican RepublicEarly-demographic dividendEast Asia & PacificEast Asia & Pacific (excluding high income)East Asia & Pacific (IDA & IBRD countries)EcuadorEgypt, Arab Rep.El SalvadorEquatorial GuineaEstoniaEthiopiaEuro areaEurope & Central AsiaEurope & Central Asia (excluding high income)Europe & Central Asia (IDA & IBRD countries)European UnionFaroe IslandsFijiFinlandFragile and conflict affected situationsFranceFrench PolynesiaGabonGambia, TheGeorgiaGermanyGhanaGibraltarGreeceGreenlandGrenadaGuamGuatemalaGuineaGuinea-BissauGuyanaHaitiHeavily indebted poor countries (HIPC)High incomeHondurasHong Kong SAR, ChinaHungaryIBRD onlyIcelandIDA & IBRD totalIDA blendIDA onlyIDA totalIndiaIndonesiaIran, Islamic Rep.IraqIrelandIsraelItalyJamaicaJapanJordanKazakhstanKenyaKiribatiKorea, Dem. People’s Rep.Korea, Rep.KosovoKuwaitKyrgyz RepublicLao PDRLate-demographic dividendLatin America & Caribbean Latin America & Caribbean (excluding high income)Latin America & the Caribbean (IDA & IBRD countries)LatviaLeast developed countries: UN classificationLebanonLiberiaLibyaLithuaniaLow & middle incomeLow incomeLower middle incomeLuxembourgMacao SAR, ChinaMacedonia, FYRMadagascarMalawiMalaysiaMaldivesMaliMaltaMauritaniaMauritiusMexicoMiddle East & North AfricaMiddle East & North Africa (excluding high income)Middle East & North Africa (IDA & IBRD countries)Middle incomeMoldovaMongoliaMontenegroMoroccoMozambiqueMyanmarNauruNepalNetherlandsNew CaledoniaNew ZealandNicaraguaNigerNigeriaNorth AmericaNorwayOECD membersOmanOther small statesPacific island small statesPakistanPanamaPapua New GuineaParaguayPeruPhilippinesPolandPortugalPost-demographic dividendPre-demographic dividendQatarRomaniaRussian FederationRwandaSamoaSao Tome and PrincipeSaudi ArabiaSenegalSerbiaSeychellesSierra LeoneSingaporeSlovak RepublicSloveniaSmall statesSolomon IslandsSomaliaSouth AfricaSouth AsiaSouth Asia (IDA & IBRD)SpainSri LankaSt. Kitts and NevisSt. LuciaSt. Vincent and the GrenadinesSub-Saharan Africa Sub-Saharan Africa (excluding high income)Sub-Saharan Africa (IDA & IBRD countries)SudanSurinameSwedenSwitzerlandSyrian Arab RepublicTajikistanTanzaniaThailandTogoTongaTrinidad and TobagoTunisiaTurkeyTurkmenistanTuvaluUgandaUkraineUnited Arab EmiratesUnited KingdomUnited StatesUpper middle incomeUruguayUzbekistanVanuatuVenezuela, RBVietnamWorldYemen, Rep.ZambiaZimbabwe Timeline:
This timeline shows a graph from 1961 to 2015 of Niger. No data until 1960. Number of actual observations by date: 55.
Source name:
World Development Indicators
Source organization:
World Bank staff estimates based data from International Monetary Fund's Direction of Trade database.
Categories, topics:
Private Sector, Trade
Last updated:
apr 23, 2017
Indicators value changes by year
Minimum:
600.0K
jan 1, 1962
Maximum:
1.977 bln
jan 1, 2015
At the date of observation
Value
Absolute change
Change from previous value
jan 1, 1961
13.6 mln
+13.6 mln
0.0%
jan 1, 1962
600.0K
-13.0 mln
-95.59%
jan 1, 1963
27.3 mln
+26.7 mln
4.45K%
jan 1, 1964
22.5 mln
-4.8 mln
-17.58%
jan 1, 1965
32.5 mln
+10.0 mln
44.44%
jan 1, 1966
37.2 mln
+4.7 mln
14.46%
jan 1, 1967
45.0 mln
+7.8 mln
20.97%
jan 1, 1968
45.5 mln
+500.0K
1.11%
jan 1, 1969
39.804 mln
-5.696 mln
-12.52%
jan 1, 1970
49.022 mln
+9.218 mln
23.16%
jan 1, 1971
58.366 mln
+9.344 mln
19.06%
jan 1, 1972
53.909 mln
-4.457 mln
-7.64%
jan 1, 1973
68.366 mln
+14.457 mln
26.82%
jan 1, 1974
86.287 mln
+17.921 mln
26.21%
jan 1, 1975
98.881 mln
+12.594 mln
14.6%
jan 1, 1976
101.638 mln
+2.757 mln
2.79%
jan 1, 1977
126.271 mln
+24.633 mln
24.24%
jan 1, 1978
195.873 mln
+69.602 mln
55.12%
jan 1, 1979
305.707 mln
+109.834 mln
56.07%
jan 1, 1980
466.713 mln
+161.006 mln
52.67%
jan 1, 1981
617.617 mln
+150.904 mln
32.33%
jan 1, 1982
534.626 mln
-82.991 mln
-13.44%
jan 1, 1983
466.237 mln
-68.389 mln
-12.79%
jan 1, 1984
323.599 mln
-142.638 mln
-30.59%
jan 1, 1985
311.475 mln
-12.124 mln
-3.75%
jan 1, 1986
368.649 mln
+57.174 mln
18.36%
jan 1, 1987
368.342 mln
-306.682K
-0.08%
jan 1, 1988
310.734 mln
-57.608 mln
-15.64%
jan 1, 1989
386.761 mln
+76.027 mln
24.47%
jan 1, 1990
363.069 mln
-23.692 mln
-6.13%
jan 1, 1991
388.78 mln
+25.711 mln
7.08%
jan 1, 1992
355.309 mln
-33.471 mln
-8.61%
jan 1, 1993
306.345 mln
-48.964 mln
-13.78%
jan 1, 1994
308.635 mln
+2.29 mln
0.75%
jan 1, 1995
225.272 mln
-83.364 mln
-27.01%
jan 1, 1996
299.658 mln
+74.386 mln
33.02%
jan 1, 1997
289.415 mln
-10.243 mln
-3.42%
jan 1, 1998
294.495 mln
+5.08 mln
1.76%
jan 1, 1999
362.604 mln
+68.109 mln
23.13%
jan 1, 2000
315.333 mln
-47.272 mln
-13.04%
jan 1, 2001
773.806 mln
+458.473 mln
145.39%
jan 1, 2002
325.027 mln
-448.779 mln
-58.0%
jan 1, 2003
395.699 mln
+70.672 mln
21.74%
jan 1, 2004
494.99 mln
+99.292 mln
25.09%
jan 1, 2005
587.957 mln
+92.966 mln
18.78%
jan 1, 2006
832.897 mln
+244.94 mln
41.66%
jan 1, 2007
997.401 mln
+164.504 mln
19.75%
jan 1, 2008
1.097 bln
+99.664 mln
9.99%
jan 1, 2009
1.694 bln
+597.376 mln
54.45%
jan 1, 2010
1.603 bln
-91.044 mln
-5.37%
jan 1, 2011
1.585 bln
-18.891 mln
-1.18%
jan 1, 2012
1.64 bln
+55.528 mln
3.5%
jan 1, 2013
1.569 bln
-71.337 mln
-4.35%
jan 1, 2014
1.763 bln
+193.874 mln
12.36%
jan 1, 2015
1.977 bln
+214.925 mln
12.19%
Ranking of countries by current statistics by years


Comments: