29
/
en
AIzaSyAYiBZKx7MnpbEhh9jyipgxe19OcubqV5w
April 1, 2024
55711
Pre-demographic dividend
PRE
false
2
1
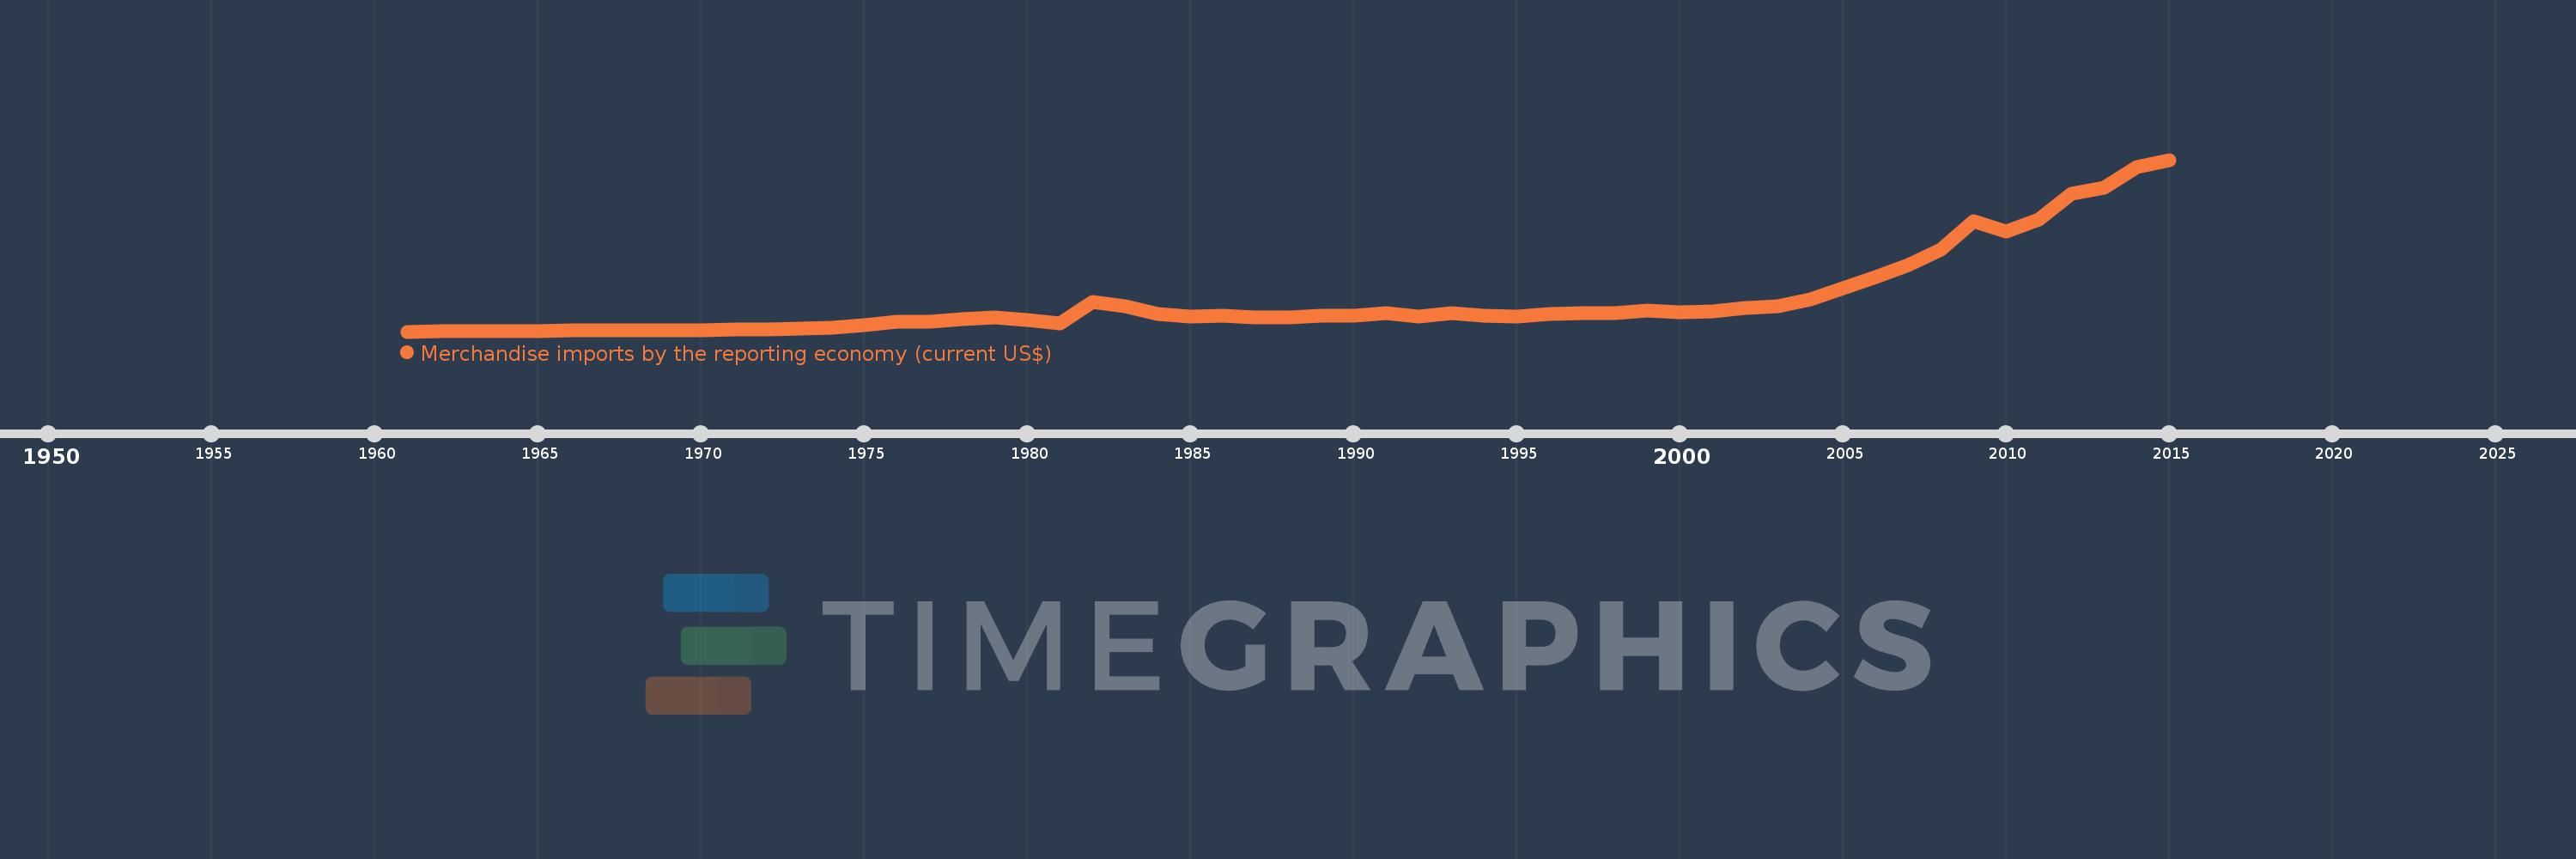
Merchandise imports by the reporting economy (current US$)
2015,2014,2013,2012,2011,2010,2009,2008,2007,2006,2005,2004,2003,2002,2001,2000,1999,1998,1997,1996,1995,1994,1993,1992,1991,1990,1989,1988,1987,1986,1985,1984,1983,1982,1981,1980,1979,1978,1977,1976,1975,1974,1973,1972,1971,1970,1969,1968,1967,1966,1965,1964,1963,1962,1961
This statistics in other country:
AfghanistanAlbaniaAlgeriaAmerican SamoaAngolaAntigua and BarbudaArab WorldArgentinaArmeniaArubaAustraliaAustriaAzerbaijanBahamas, TheBahrainBangladeshBarbadosBelarusBelgiumBelizeBeninBermudaBoliviaBosnia and HerzegovinaBrazilBrunei DarussalamBulgariaBurkina FasoBurundiCabo VerdeCambodiaCameroonCanadaCaribbean small statesCentral African RepublicCentral Europe and the BalticsChadChileChinaColombiaComorosCongo, Dem. Rep.Congo, Rep.Costa RicaCote d'IvoireCroatiaCubaCyprusCzech RepublicDenmarkDjiboutiDominicaDominican RepublicEarly-demographic dividendEast Asia & PacificEast Asia & Pacific (excluding high income)East Asia & Pacific (IDA & IBRD countries)EcuadorEgypt, Arab Rep.El SalvadorEquatorial GuineaEstoniaEthiopiaEuro areaEurope & Central AsiaEurope & Central Asia (excluding high income)Europe & Central Asia (IDA & IBRD countries)European UnionFaroe IslandsFijiFinlandFragile and conflict affected situationsFranceFrench PolynesiaGabonGambia, TheGeorgiaGermanyGhanaGibraltarGreeceGreenlandGrenadaGuamGuatemalaGuineaGuinea-BissauGuyanaHaitiHeavily indebted poor countries (HIPC)High incomeHondurasHong Kong SAR, ChinaHungaryIBRD onlyIcelandIDA & IBRD totalIDA blendIDA onlyIDA totalIndiaIndonesiaIran, Islamic Rep.IraqIrelandIsraelItalyJamaicaJapanJordanKazakhstanKenyaKiribatiKorea, Dem. People’s Rep.Korea, Rep.KosovoKuwaitKyrgyz RepublicLao PDRLate-demographic dividendLatin America & Caribbean Latin America & Caribbean (excluding high income)Latin America & the Caribbean (IDA & IBRD countries)LatviaLeast developed countries: UN classificationLebanonLiberiaLibyaLithuaniaLow & middle incomeLow incomeLower middle incomeLuxembourgMacao SAR, ChinaMacedonia, FYRMadagascarMalawiMalaysiaMaldivesMaliMaltaMauritaniaMauritiusMexicoMiddle East & North AfricaMiddle East & North Africa (excluding high income)Middle East & North Africa (IDA & IBRD countries)Middle incomeMoldovaMongoliaMontenegroMoroccoMozambiqueMyanmarNauruNepalNetherlandsNew CaledoniaNew ZealandNicaraguaNigerNigeriaNorth AmericaNorwayOECD membersOmanOther small statesPacific island small statesPakistanPanamaPapua New GuineaParaguayPeruPhilippinesPolandPortugalPost-demographic dividendPre-demographic dividendQatarRomaniaRussian FederationRwandaSamoaSao Tome and PrincipeSaudi ArabiaSenegalSerbiaSeychellesSierra LeoneSingaporeSlovak RepublicSloveniaSmall statesSolomon IslandsSomaliaSouth AfricaSouth AsiaSouth Asia (IDA & IBRD)SpainSri LankaSt. Kitts and NevisSt. LuciaSt. Vincent and the GrenadinesSub-Saharan Africa Sub-Saharan Africa (excluding high income)Sub-Saharan Africa (IDA & IBRD countries)SudanSurinameSwedenSwitzerlandSyrian Arab RepublicTajikistanTanzaniaThailandTogoTongaTrinidad and TobagoTunisiaTurkeyTurkmenistanTuvaluUgandaUkraineUnited Arab EmiratesUnited KingdomUnited StatesUpper middle incomeUruguayUzbekistanVanuatuVenezuela, RBVietnamWorldYemen, Rep.ZambiaZimbabwe Timeline:
This timeline shows a graph from 1961 to 2015 of Pre-demographic dividend. No data until 1960. Number of actual observations by date: 55.
Source name:
World Development Indicators
Source organization:
World Bank staff estimates based data from International Monetary Fund's Direction of Trade database.
Categories, topics:
Private Sector, Trade
Last updated:
apr 23, 2017
Indicators value changes by year
Minimum:
2.424 bln
jan 1, 1961
Maximum:
336.113 bln
jan 1, 2015
At the date of observation
Value
Absolute change
Change from previous value
jan 1, 1961
2.424 bln
+2.424 bln
0.0%
jan 1, 1962
2.618 bln
+194.08 mln
8.01%
jan 1, 1963
2.722 bln
+104.3 mln
3.98%
jan 1, 1964
3.116 bln
+393.409 mln
14.45%
jan 1, 1965
3.943 bln
+827.498 mln
26.56%
jan 1, 1966
4.216 bln
+273.27 mln
6.93%
jan 1, 1967
4.533 bln
+316.846 mln
7.51%
jan 1, 1968
4.711 bln
+177.254 mln
3.91%
jan 1, 1969
5.046 bln
+335.75 mln
7.13%
jan 1, 1970
5.567 bln
+520.871 mln
10.32%
jan 1, 1971
6.619 bln
+1.051 bln
18.89%
jan 1, 1972
7.293 bln
+674.693 mln
10.19%
jan 1, 1973
8.199 bln
+906.041 mln
12.42%
jan 1, 1974
10.129 bln
+1.93 bln
23.53%
jan 1, 1975
15.217 bln
+5.089 bln
50.24%
jan 1, 1976
20.844 bln
+5.627 bln
36.97%
jan 1, 1977
21.63 bln
+785.965 mln
3.77%
jan 1, 1978
27.415 bln
+5.785 bln
26.74%
jan 1, 1979
30.335 bln
+2.921 bln
10.65%
jan 1, 1980
24.884 bln
-5.451 bln
-17.97%
jan 1, 1981
18.6 bln
-6.284 bln
-25.25%
jan 1, 1982
59.404 bln
+40.804 bln
219.37%
jan 1, 1983
52.409 bln
-6.995 bln
-11.78%
jan 1, 1984
36.241 bln
-16.168 bln
-30.85%
jan 1, 1985
31.065 bln
-5.175 bln
-14.28%
jan 1, 1986
32.82 bln
+1.755 bln
5.65%
jan 1, 1987
29.479 bln
-3.341 bln
-10.18%
jan 1, 1988
30.116 bln
+637.021 mln
2.16%
jan 1, 1989
32.473 bln
+2.357 bln
7.83%
jan 1, 1990
34.065 bln
+1.592 bln
4.9%
jan 1, 1991
37.738 bln
+3.673 bln
10.78%
jan 1, 1992
32.089 bln
-5.65 bln
-14.97%
jan 1, 1993
39.1 bln
+7.011 bln
21.85%
jan 1, 1994
33.75 bln
-5.349 bln
-13.68%
jan 1, 1995
32.089 bln
-1.662 bln
-4.92%
jan 1, 1996
37.422 bln
+5.334 bln
16.62%
jan 1, 1997
37.732 bln
+309.13 mln
0.83%
jan 1, 1998
37.826 bln
+94.132 mln
0.25%
jan 1, 1999
43.074 bln
+5.248 bln
13.88%
jan 1, 2000
39.921 bln
-3.153 bln
-7.32%
jan 1, 2001
41.591 bln
+1.67 bln
4.18%
jan 1, 2002
48.299 bln
+6.708 bln
16.13%
jan 1, 2003
51.538 bln
+3.24 bln
6.71%
jan 1, 2004
64.466 bln
+12.927 bln
25.08%
jan 1, 2005
87.309 bln
+22.844 bln
35.44%
jan 1, 2006
109.161 bln
+21.852 bln
25.03%
jan 1, 2007
132.019 bln
+22.858 bln
20.94%
jan 1, 2008
161.545 bln
+29.525 bln
22.36%
jan 1, 2009
217.411 bln
+55.866 bln
34.58%
jan 1, 2010
196.624 bln
-20.787 bln
-9.56%
jan 1, 2011
219.68 bln
+23.056 bln
11.73%
jan 1, 2012
270.674 bln
+50.994 bln
23.21%
jan 1, 2013
282.287 bln
+11.613 bln
4.29%
jan 1, 2014
322.5 bln
+40.213 bln
14.25%
jan 1, 2015
336.113 bln
+13.613 bln
4.22%
Ranking of countries by current statistics by years


Comments: