29
/
en
AIzaSyAYiBZKx7MnpbEhh9jyipgxe19OcubqV5w
April 1, 2024
34388
Fragile and conflict affected situations
FCS
false
2
1
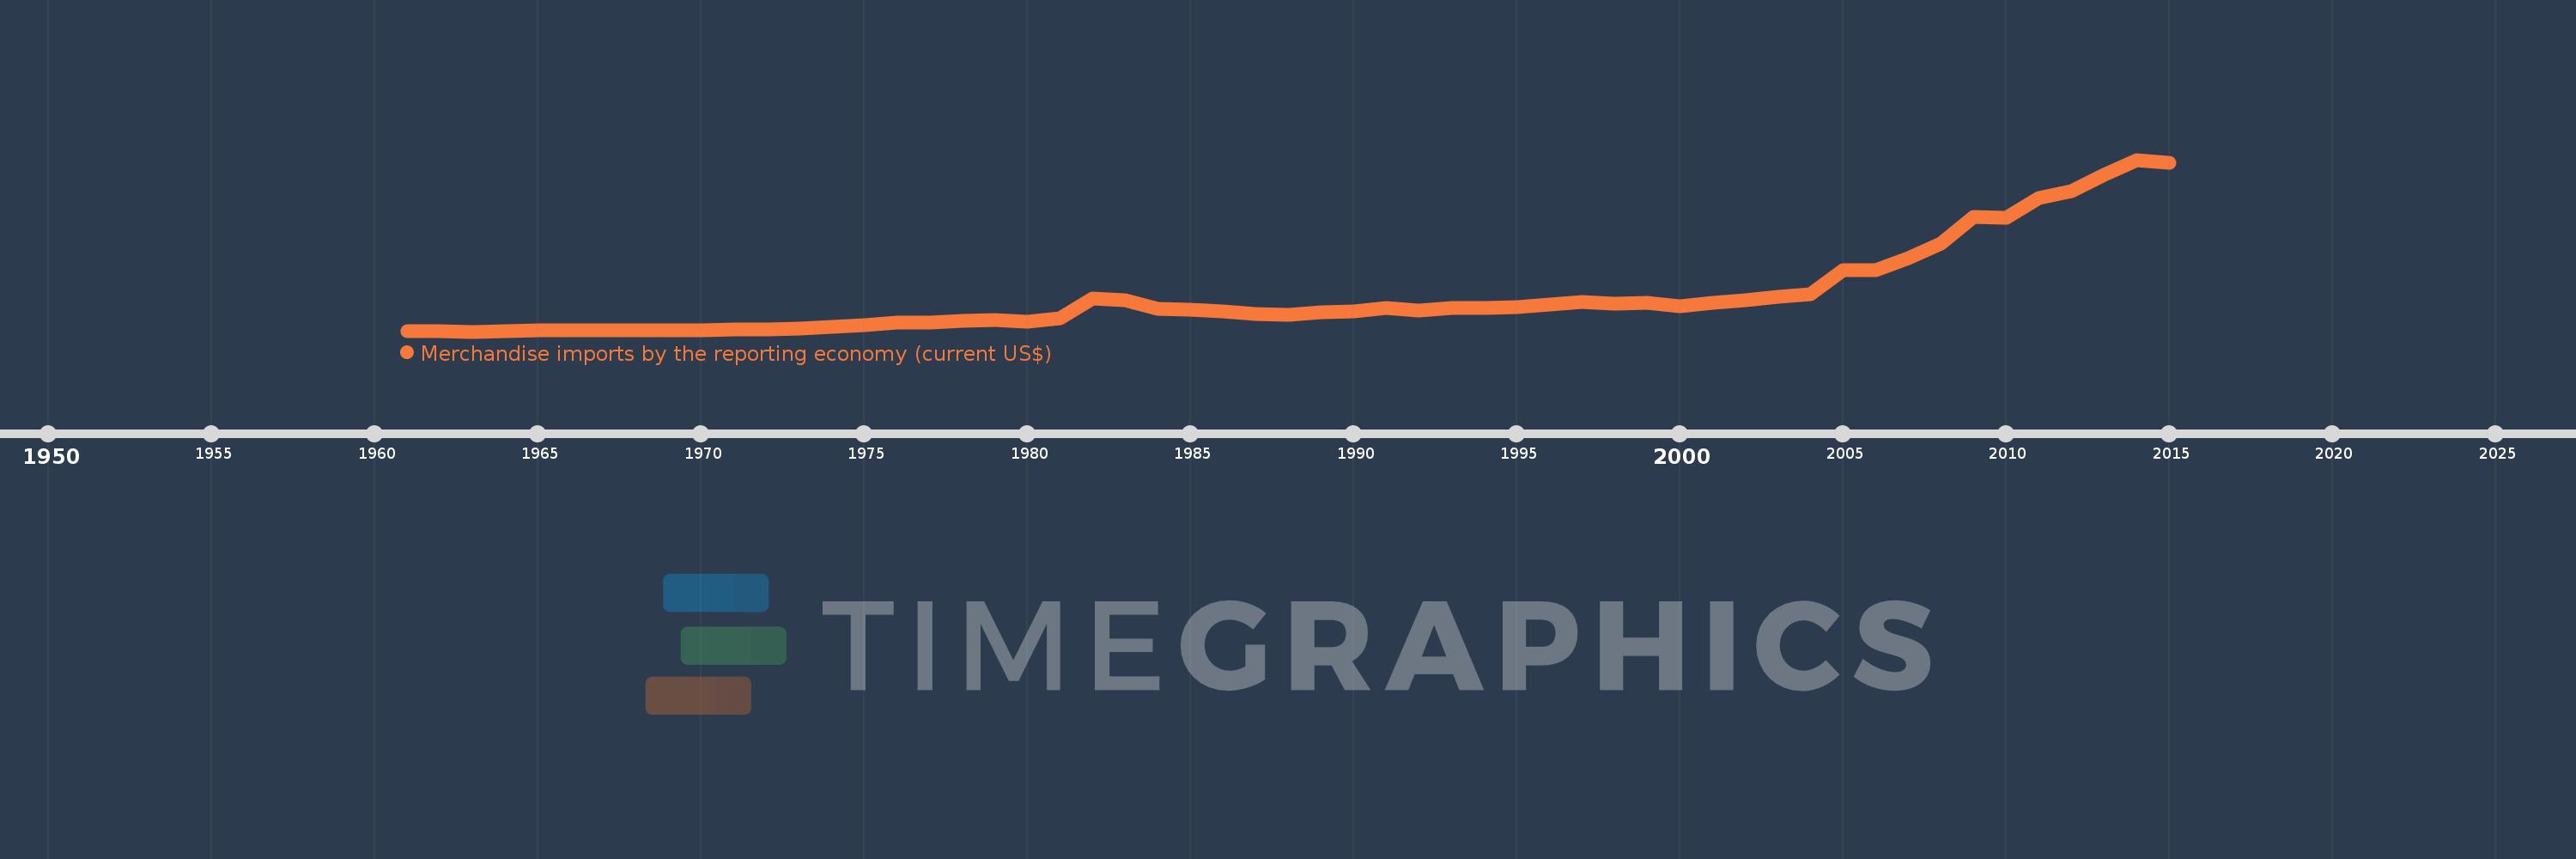
Merchandise imports by the reporting economy (current US$)
2015,2014,2013,2012,2011,2010,2009,2008,2007,2006,2005,2004,2003,2002,2001,2000,1999,1998,1997,1996,1995,1994,1993,1992,1991,1990,1989,1988,1987,1986,1985,1984,1983,1982,1981,1980,1979,1978,1977,1976,1975,1974,1973,1972,1971,1970,1969,1968,1967,1966,1965,1964,1963,1962,1961
This statistics in other country:
AfghanistanAlbaniaAlgeriaAmerican SamoaAngolaAntigua and BarbudaArab WorldArgentinaArmeniaArubaAustraliaAustriaAzerbaijanBahamas, TheBahrainBangladeshBarbadosBelarusBelgiumBelizeBeninBermudaBoliviaBosnia and HerzegovinaBrazilBrunei DarussalamBulgariaBurkina FasoBurundiCabo VerdeCambodiaCameroonCanadaCaribbean small statesCentral African RepublicCentral Europe and the BalticsChadChileChinaColombiaComorosCongo, Dem. Rep.Congo, Rep.Costa RicaCote d'IvoireCroatiaCubaCyprusCzech RepublicDenmarkDjiboutiDominicaDominican RepublicEarly-demographic dividendEast Asia & PacificEast Asia & Pacific (excluding high income)East Asia & Pacific (IDA & IBRD countries)EcuadorEgypt, Arab Rep.El SalvadorEquatorial GuineaEstoniaEthiopiaEuro areaEurope & Central AsiaEurope & Central Asia (excluding high income)Europe & Central Asia (IDA & IBRD countries)European UnionFaroe IslandsFijiFinlandFragile and conflict affected situationsFranceFrench PolynesiaGabonGambia, TheGeorgiaGermanyGhanaGibraltarGreeceGreenlandGrenadaGuamGuatemalaGuineaGuinea-BissauGuyanaHaitiHeavily indebted poor countries (HIPC)High incomeHondurasHong Kong SAR, ChinaHungaryIBRD onlyIcelandIDA & IBRD totalIDA blendIDA onlyIDA totalIndiaIndonesiaIran, Islamic Rep.IraqIrelandIsraelItalyJamaicaJapanJordanKazakhstanKenyaKiribatiKorea, Dem. People’s Rep.Korea, Rep.KosovoKuwaitKyrgyz RepublicLao PDRLate-demographic dividendLatin America & Caribbean Latin America & Caribbean (excluding high income)Latin America & the Caribbean (IDA & IBRD countries)LatviaLeast developed countries: UN classificationLebanonLiberiaLibyaLithuaniaLow & middle incomeLow incomeLower middle incomeLuxembourgMacao SAR, ChinaMacedonia, FYRMadagascarMalawiMalaysiaMaldivesMaliMaltaMauritaniaMauritiusMexicoMiddle East & North AfricaMiddle East & North Africa (excluding high income)Middle East & North Africa (IDA & IBRD countries)Middle incomeMoldovaMongoliaMontenegroMoroccoMozambiqueMyanmarNauruNepalNetherlandsNew CaledoniaNew ZealandNicaraguaNigerNigeriaNorth AmericaNorwayOECD membersOmanOther small statesPacific island small statesPakistanPanamaPapua New GuineaParaguayPeruPhilippinesPolandPortugalPost-demographic dividendPre-demographic dividendQatarRomaniaRussian FederationRwandaSamoaSao Tome and PrincipeSaudi ArabiaSenegalSerbiaSeychellesSierra LeoneSingaporeSlovak RepublicSloveniaSmall statesSolomon IslandsSomaliaSouth AfricaSouth AsiaSouth Asia (IDA & IBRD)SpainSri LankaSt. Kitts and NevisSt. LuciaSt. Vincent and the GrenadinesSub-Saharan Africa Sub-Saharan Africa (excluding high income)Sub-Saharan Africa (IDA & IBRD countries)SudanSurinameSwedenSwitzerlandSyrian Arab RepublicTajikistanTanzaniaThailandTogoTongaTrinidad and TobagoTunisiaTurkeyTurkmenistanTuvaluUgandaUkraineUnited Arab EmiratesUnited KingdomUnited StatesUpper middle incomeUruguayUzbekistanVanuatuVenezuela, RBVietnamWorldYemen, Rep.ZambiaZimbabwe Timeline:
This timeline shows a graph from 1961 to 2015 of Fragile and conflict affected situations. No data until 1960. Number of actual observations by date: 55.
Source name:
World Development Indicators
Source organization:
World Bank staff estimates based data from International Monetary Fund's Direction of Trade database.
Categories, topics:
Private Sector, Trade
Last updated:
apr 23, 2017
Indicators value changes by year
Minimum:
1.76 bln
jan 1, 1963
Maximum:
254.693 bln
jan 1, 2014
At the date of observation
Value
Absolute change
Change from previous value
jan 1, 1961
1.923 bln
+1.923 bln
0.0%
jan 1, 1962
1.938 bln
+14.904 mln
0.78%
jan 1, 1963
1.76 bln
-177.996 mln
-9.19%
jan 1, 1964
2.507 bln
+747.288 mln
42.46%
jan 1, 1965
3.465 bln
+958.351 mln
38.23%
jan 1, 1966
3.56 bln
+94.823 mln
2.74%
jan 1, 1967
3.514 bln
-46.764 mln
-1.31%
jan 1, 1968
3.44 bln
-73.733 mln
-2.1%
jan 1, 1969
3.826 bln
+386.572 mln
11.24%
jan 1, 1970
4.271 bln
+444.835 mln
11.63%
jan 1, 1971
4.546 bln
+274.63 mln
6.43%
jan 1, 1972
4.727 bln
+181.294 mln
3.99%
jan 1, 1973
6.164 bln
+1.437 bln
30.39%
jan 1, 1974
8.215 bln
+2.051 bln
33.27%
jan 1, 1975
11.487 bln
+3.272 bln
39.83%
jan 1, 1976
15.631 bln
+4.144 bln
36.08%
jan 1, 1977
14.911 bln
-720.382 mln
-4.61%
jan 1, 1978
17.488 bln
+2.577 bln
17.29%
jan 1, 1979
18.458 bln
+970.349 mln
5.55%
jan 1, 1980
16.534 bln
-1.925 bln
-10.43%
jan 1, 1981
21.748 bln
+5.215 bln
31.54%
jan 1, 1982
50.051 bln
+28.303 bln
130.14%
jan 1, 1983
48.24 bln
-1.811 bln
-3.62%
jan 1, 1984
35.802 bln
-12.437 bln
-25.78%
jan 1, 1985
33.459 bln
-2.344 bln
-6.55%
jan 1, 1986
31.525 bln
-1.933 bln
-5.78%
jan 1, 1987
27.392 bln
-4.134 bln
-13.11%
jan 1, 1988
27.006 bln
-385.876 mln
-1.41%
jan 1, 1989
30.578 bln
+3.572 bln
13.23%
jan 1, 1990
30.939 bln
+360.943 mln
1.18%
jan 1, 1991
37.159 bln
+6.22 bln
20.1%
jan 1, 1992
33.018 bln
-4.141 bln
-11.14%
jan 1, 1993
36.215 bln
+3.197 bln
9.68%
jan 1, 1994
36.409 bln
+193.946 mln
0.54%
jan 1, 1995
37.934 bln
+1.525 bln
4.19%
jan 1, 1996
42.181 bln
+4.247 bln
11.2%
jan 1, 1997
44.921 bln
+2.74 bln
6.5%
jan 1, 1998
42.681 bln
-2.239 bln
-4.98%
jan 1, 1999
44.519 bln
+1.838 bln
4.31%
jan 1, 2000
38.909 bln
-5.61 bln
-12.6%
jan 1, 2001
44.022 bln
+5.112 bln
13.14%
jan 1, 2002
48.454 bln
+4.433 bln
10.07%
jan 1, 2003
52.509 bln
+4.055 bln
8.37%
jan 1, 2004
56.913 bln
+4.404 bln
8.39%
jan 1, 2005
91.679 bln
+34.766 bln
61.09%
jan 1, 2006
92.252 bln
+572.503 mln
0.62%
jan 1, 2007
109.708 bln
+17.457 bln
18.92%
jan 1, 2008
131.085 bln
+21.377 bln
19.49%
jan 1, 2009
171.063 bln
+39.978 bln
30.5%
jan 1, 2010
169.902 bln
-1.161 bln
-0.68%
jan 1, 2011
197.994 bln
+28.092 bln
16.53%
jan 1, 2012
208.238 bln
+10.245 bln
5.17%
jan 1, 2013
233.052 bln
+24.814 bln
11.92%
jan 1, 2014
254.693 bln
+21.641 bln
9.29%
jan 1, 2015
249.637 bln
-5.056 bln
-1.99%
Ranking of countries by current statistics by years


Comments: