29
/
en
AIzaSyAYiBZKx7MnpbEhh9jyipgxe19OcubqV5w
April 1, 2024
226166
Portugal
PRT
true
2
1
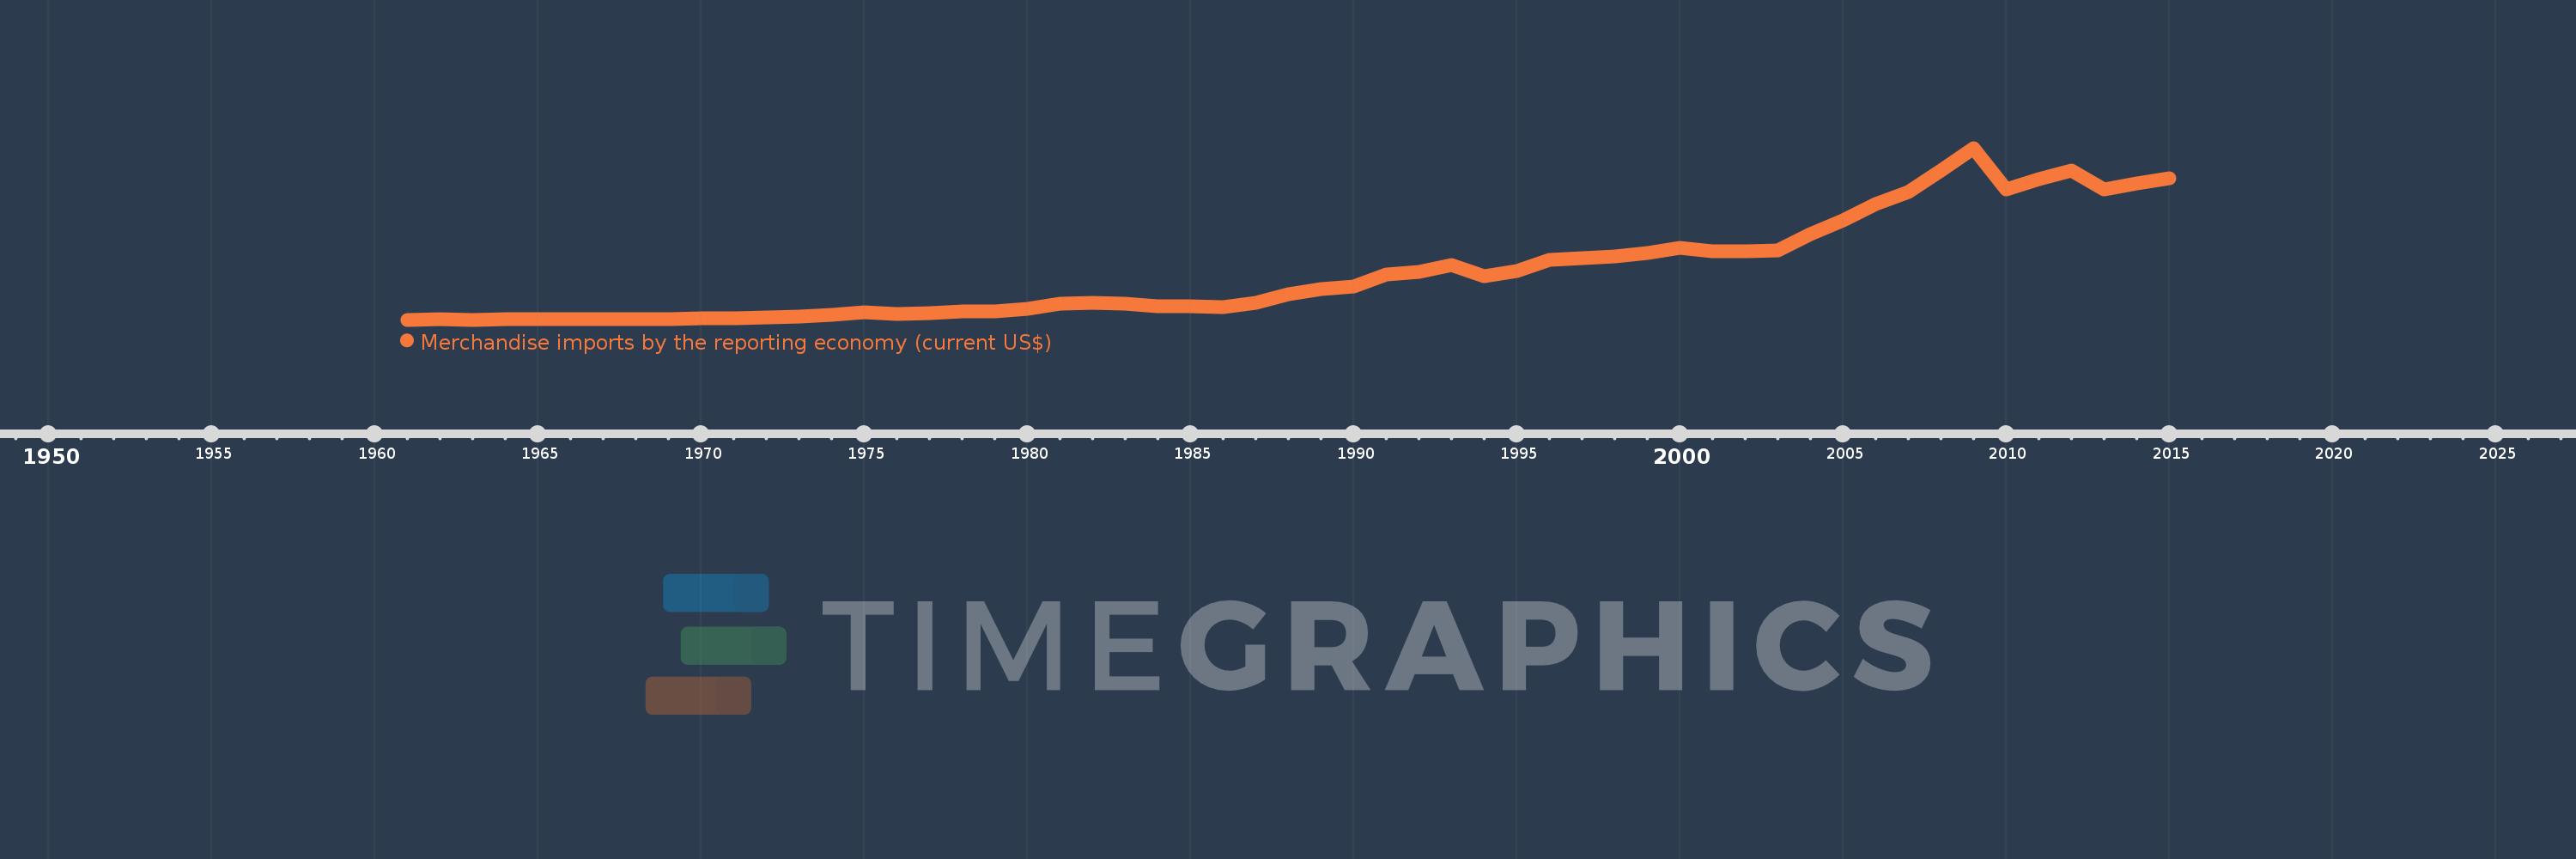
Merchandise imports by the reporting economy (current US$)
2015,2014,2013,2012,2011,2010,2009,2008,2007,2006,2005,2004,2003,2002,2001,2000,1999,1998,1997,1996,1995,1994,1993,1992,1991,1990,1989,1988,1987,1986,1985,1984,1983,1982,1981,1980,1979,1978,1977,1976,1975,1974,1973,1972,1971,1970,1969,1968,1967,1966,1965,1964,1963,1962,1961
This statistics in other country:
AfghanistanAlbaniaAlgeriaAmerican SamoaAngolaAntigua and BarbudaArab WorldArgentinaArmeniaArubaAustraliaAustriaAzerbaijanBahamas, TheBahrainBangladeshBarbadosBelarusBelgiumBelizeBeninBermudaBoliviaBosnia and HerzegovinaBrazilBrunei DarussalamBulgariaBurkina FasoBurundiCabo VerdeCambodiaCameroonCanadaCaribbean small statesCentral African RepublicCentral Europe and the BalticsChadChileChinaColombiaComorosCongo, Dem. Rep.Congo, Rep.Costa RicaCote d'IvoireCroatiaCubaCyprusCzech RepublicDenmarkDjiboutiDominicaDominican RepublicEarly-demographic dividendEast Asia & PacificEast Asia & Pacific (excluding high income)East Asia & Pacific (IDA & IBRD countries)EcuadorEgypt, Arab Rep.El SalvadorEquatorial GuineaEstoniaEthiopiaEuro areaEurope & Central AsiaEurope & Central Asia (excluding high income)Europe & Central Asia (IDA & IBRD countries)European UnionFaroe IslandsFijiFinlandFragile and conflict affected situationsFranceFrench PolynesiaGabonGambia, TheGeorgiaGermanyGhanaGibraltarGreeceGreenlandGrenadaGuamGuatemalaGuineaGuinea-BissauGuyanaHaitiHeavily indebted poor countries (HIPC)High incomeHondurasHong Kong SAR, ChinaHungaryIBRD onlyIcelandIDA & IBRD totalIDA blendIDA onlyIDA totalIndiaIndonesiaIran, Islamic Rep.IraqIrelandIsraelItalyJamaicaJapanJordanKazakhstanKenyaKiribatiKorea, Dem. People’s Rep.Korea, Rep.KosovoKuwaitKyrgyz RepublicLao PDRLate-demographic dividendLatin America & Caribbean Latin America & Caribbean (excluding high income)Latin America & the Caribbean (IDA & IBRD countries)LatviaLeast developed countries: UN classificationLebanonLiberiaLibyaLithuaniaLow & middle incomeLow incomeLower middle incomeLuxembourgMacao SAR, ChinaMacedonia, FYRMadagascarMalawiMalaysiaMaldivesMaliMaltaMauritaniaMauritiusMexicoMiddle East & North AfricaMiddle East & North Africa (excluding high income)Middle East & North Africa (IDA & IBRD countries)Middle incomeMoldovaMongoliaMontenegroMoroccoMozambiqueMyanmarNauruNepalNetherlandsNew CaledoniaNew ZealandNicaraguaNigerNigeriaNorth AmericaNorwayOECD membersOmanOther small statesPacific island small statesPakistanPanamaPapua New GuineaParaguayPeruPhilippinesPolandPortugalPost-demographic dividendPre-demographic dividendQatarRomaniaRussian FederationRwandaSamoaSao Tome and PrincipeSaudi ArabiaSenegalSerbiaSeychellesSierra LeoneSingaporeSlovak RepublicSloveniaSmall statesSolomon IslandsSomaliaSouth AfricaSouth AsiaSouth Asia (IDA & IBRD)SpainSri LankaSt. Kitts and NevisSt. LuciaSt. Vincent and the GrenadinesSub-Saharan Africa Sub-Saharan Africa (excluding high income)Sub-Saharan Africa (IDA & IBRD countries)SudanSurinameSwedenSwitzerlandSyrian Arab RepublicTajikistanTanzaniaThailandTogoTongaTrinidad and TobagoTunisiaTurkeyTurkmenistanTuvaluUgandaUkraineUnited Arab EmiratesUnited KingdomUnited StatesUpper middle incomeUruguayUzbekistanVanuatuVenezuela, RBVietnamWorldYemen, Rep.ZambiaZimbabwe Timeline:
This timeline shows a graph from 1961 to 2015 of Portugal. No data until 1960. Number of actual observations by date: 55.
Source name:
World Development Indicators
Source organization:
World Bank staff estimates based data from International Monetary Fund's Direction of Trade database.
Categories, topics:
Private Sector, Trade
Last updated:
apr 23, 2017
Indicators value changes by year
Minimum:
539.53 mln
jan 1, 1961
Maximum:
94.628 bln
jan 1, 2009
At the date of observation
Value
Absolute change
Change from previous value
jan 1, 1961
539.53 mln
+539.53 mln
0.0%
jan 1, 1962
648.39 mln
+108.86 mln
20.18%
jan 1, 1963
578.3 mln
-70.09 mln
-10.81%
jan 1, 1964
646.0 mln
+67.7 mln
11.71%
jan 1, 1965
758.4 mln
+112.4 mln
17.4%
jan 1, 1966
919.5 mln
+161.1 mln
21.24%
jan 1, 1967
1.008 bln
+88.3 mln
9.6%
jan 1, 1968
1.013 bln
+5.3 mln
0.53%
jan 1, 1969
1.037 bln
+24.3 mln
2.4%
jan 1, 1970
1.241 bln
+203.96 mln
19.66%
jan 1, 1971
1.565 bln
+323.26 mln
26.04%
jan 1, 1972
1.779 bln
+214.22 mln
13.69%
jan 1, 1973
2.185 bln
+406.53 mln
22.85%
jan 1, 1974
3.019 bln
+833.38 mln
38.13%
jan 1, 1975
4.647 bln
+1.628 bln
53.95%
jan 1, 1976
3.83 bln
-817.62 mln
-17.59%
jan 1, 1977
4.203 bln
+373.56 mln
9.75%
jan 1, 1978
4.978 bln
+775.21 mln
18.44%
jan 1, 1979
5.239 bln
+260.29 mln
5.23%
jan 1, 1980
6.529 bln
+1.291 bln
24.64%
jan 1, 1981
9.334 bln
+2.805 bln
42.95%
jan 1, 1982
9.912 bln
+578.14 mln
6.19%
jan 1, 1983
9.486 bln
-426.41 mln
-4.3%
jan 1, 1984
8.11 bln
-1.375 bln
-14.5%
jan 1, 1985
7.966 bln
-144.3 mln
-1.78%
jan 1, 1986
7.661 bln
-305.22 mln
-3.83%
jan 1, 1987
9.64 bln
+1.98 bln
25.84%
jan 1, 1988
14.489 bln
+4.849 bln
50.3%
jan 1, 1989
17.339 bln
+2.85 bln
19.67%
jan 1, 1990
18.978 bln
+1.639 bln
9.45%
jan 1, 1991
25.104 bln
+6.126 bln
32.28%
jan 1, 1992
26.804 bln
+1.701 bln
6.77%
jan 1, 1993
30.739 bln
+3.935 bln
14.68%
jan 1, 1994
24.312 bln
-6.427 bln
-20.91%
jan 1, 1995
27.024 bln
+2.712 bln
11.16%
jan 1, 1996
33.309 bln
+6.285 bln
23.26%
jan 1, 1997
34.137 bln
+828.157 mln
2.49%
jan 1, 1998
35.214 bln
+1.077 bln
3.15%
jan 1, 1999
36.911 bln
+1.698 bln
4.82%
jan 1, 2000
39.917 bln
+3.006 bln
8.14%
jan 1, 2001
38.224 bln
-1.693 bln
-4.24%
jan 1, 2002
37.925 bln
-298.637 mln
-0.78%
jan 1, 2003
38.342 bln
+416.81 mln
1.1%
jan 1, 2004
47.222 bln
+8.879 bln
23.16%
jan 1, 2005
54.865 bln
+7.644 bln
16.19%
jan 1, 2006
63.878 bln
+9.012 bln
16.43%
jan 1, 2007
70.711 bln
+6.833 bln
10.7%
jan 1, 2008
82.272 bln
+11.561 bln
16.35%
jan 1, 2009
94.628 bln
+12.356 bln
15.02%
jan 1, 2010
71.78 bln
-22.849 bln
-24.15%
jan 1, 2011
77.45 bln
+5.671 bln
7.9%
jan 1, 2012
82.462 bln
+5.012 bln
6.47%
jan 1, 2013
72.081 bln
-10.381 bln
-12.59%
jan 1, 2014
75.336 bln
+3.254 bln
4.51%
jan 1, 2015
77.791 bln
+2.456 bln
3.26%
Ranking of countries by current statistics by years


Comments: