29
/
en
AIzaSyAYiBZKx7MnpbEhh9jyipgxe19OcubqV5w
April 1, 2024
61392
Upper middle income
UMC
false
2
1
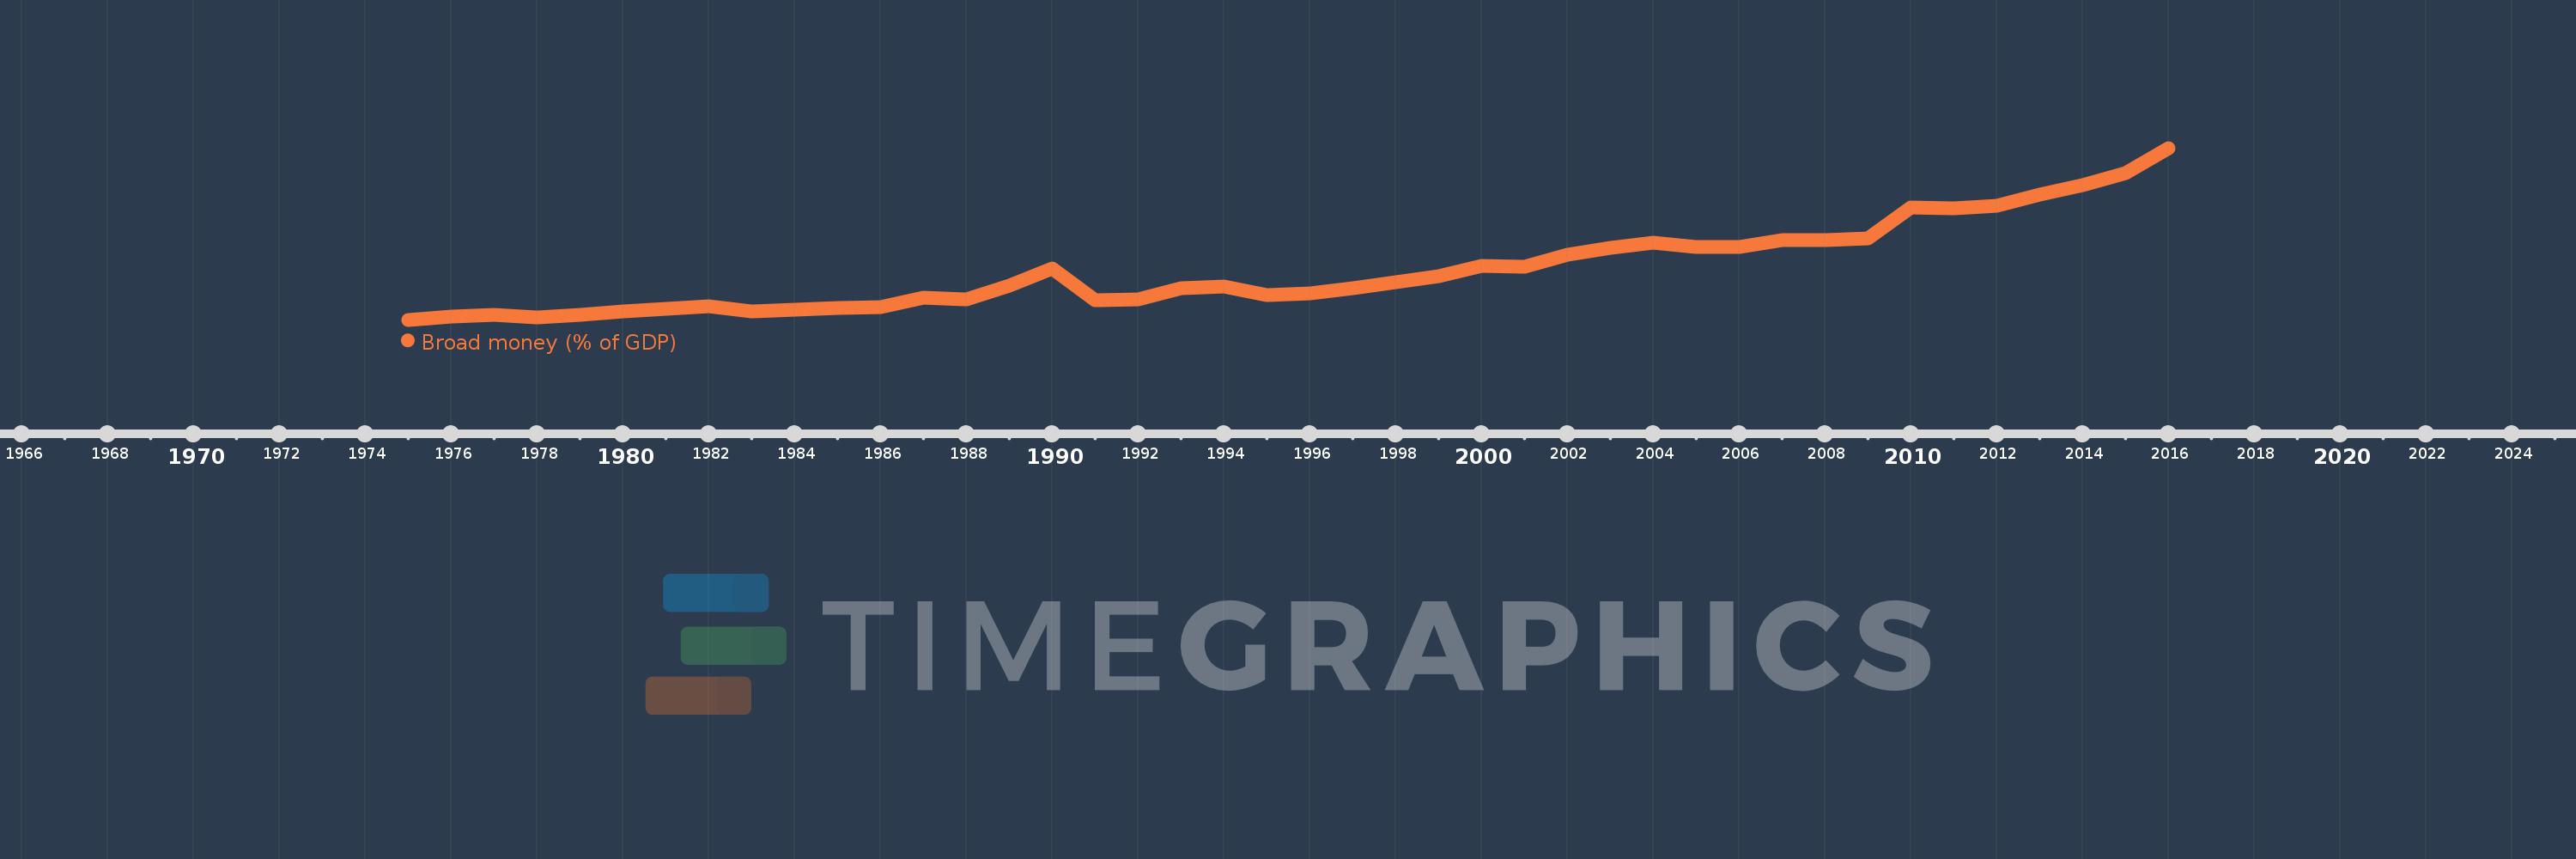
Broad money (% of GDP)
2016,2015,2014,2013,2012,2011,2010,2009,2008,2007,2006,2005,2004,2003,2002,2001,2000,1999,1998,1997,1996,1995,1994,1993,1992,1991,1990,1989,1988,1987,1986,1985,1984,1983,1982,1981,1980,1979,1978,1977,1976,1975
This statistics in other country:
AfghanistanAlbaniaAlgeriaAngolaAntigua and BarbudaArab WorldArgentinaArmeniaArubaAustraliaAzerbaijanBahamas, TheBahrainBangladeshBarbadosBelarusBelizeBeninBhutanBoliviaBosnia and HerzegovinaBotswanaBrazilBrunei DarussalamBulgariaBurkina FasoBurundiCabo VerdeCambodiaCameroonCanadaCaribbean small statesCentral African RepublicCentral Europe and the BalticsChadChileChinaColombiaComorosCongo, Dem. Rep.Congo, Rep.Costa RicaCote d'IvoireCroatiaCzech RepublicDenmarkDjiboutiDominicaDominican RepublicEarly-demographic dividendEast Asia & PacificEast Asia & Pacific (excluding high income)East Asia & Pacific (IDA & IBRD countries)EcuadorEgypt, Arab Rep.El SalvadorEquatorial GuineaEritreaEstoniaEthiopiaEurope & Central Asia (excluding high income)Europe & Central Asia (IDA & IBRD countries)FijiFragile and conflict affected situationsGabonGambia, TheGeorgiaGhanaGrenadaGuatemalaGuineaGuinea-BissauGuyanaHaitiHeavily indebted poor countries (HIPC)High incomeHondurasHong Kong SAR, ChinaHungaryIBRD onlyIcelandIDA & IBRD totalIDA blendIDA onlyIDA totalIndiaIndonesiaIran, Islamic Rep.IraqIsraelJamaicaJapanJordanKazakhstanKenyaKorea, Rep.KuwaitKyrgyz RepublicLao PDRLate-demographic dividendLatin America & Caribbean Latin America & Caribbean (excluding high income)Latin America & the Caribbean (IDA & IBRD countries)LatviaLeast developed countries: UN classificationLebanonLesothoLiberiaLibyaLithuaniaLow & middle incomeLow incomeLower middle incomeMacao SAR, ChinaMacedonia, FYRMadagascarMalawiMalaysiaMaldivesMaliMauritaniaMauritiusMexicoMicronesia, Fed. Sts.Middle East & North AfricaMiddle East & North Africa (excluding high income)Middle East & North Africa (IDA & IBRD countries)Middle incomeMoldovaMongoliaMoroccoMozambiqueMyanmarNamibiaNepalNew ZealandNicaraguaNigerNigeriaNorth AmericaNorwayOECD membersOmanOther small statesPacific island small statesPakistanPanamaPapua New GuineaParaguayPeruPhilippinesPolandPost-demographic dividendPre-demographic dividendQatarRomaniaRussian FederationRwandaSamoaSao Tome and PrincipeSaudi ArabiaSenegalSerbiaSeychellesSierra LeoneSingaporeSlovak RepublicSmall statesSolomon IslandsSouth AfricaSouth AsiaSouth Asia (IDA & IBRD)South SudanSri LankaSt. Kitts and NevisSt. LuciaSt. Vincent and the GrenadinesSub-Saharan Africa Sub-Saharan Africa (excluding high income)Sub-Saharan Africa (IDA & IBRD countries)SudanSurinameSwazilandSwedenSwitzerlandSyrian Arab RepublicTajikistanTanzaniaThailandTimor-LesteTogoTongaTrinidad and TobagoTunisiaTurkeyUgandaUkraineUnited Arab EmiratesUnited KingdomUnited StatesUpper middle incomeUruguayVanuatuVenezuela, RBVietnamWest Bank and GazaWorldYemen, Rep.ZambiaZimbabwe Timeline:
This timeline shows a graph from 1975 to 2016 of Upper middle income. No data until 1974. Number of actual observations by date: 42.
Source name:
World Development Indicators
Source organization:
International Monetary Fund, International Financial Statistics and data files, and World Bank and OECD GDP estimates.
Categories, topics:
Financial Sector
Last updated:
apr 23, 2017
Indicators value changes by year
Minimum:
30.632
jan 1, 1975
Maximum:
145.067
jan 1, 2016
At the date of observation
Value
Absolute change
Change from previous value
jan 1, 1975
30.632
+30.632
0.0%
jan 1, 1976
32.628
+1.996
6.52%
jan 1, 1977
33.856
+1.228
3.76%
jan 1, 1978
31.945
-1.911
-5.65%
jan 1, 1979
33.97
+2.025
6.34%
jan 1, 1980
36.144
+2.174
6.4%
jan 1, 1981
37.957
+1.813
5.02%
jan 1, 1982
39.565
+1.608
4.24%
jan 1, 1983
36.441
-3.124
-7.9%
jan 1, 1984
37.286
+0.845
2.32%
jan 1, 1985
38.264
+0.978
2.62%
jan 1, 1986
38.817
+0.553
1.44%
jan 1, 1987
45.263
+6.446
16.61%
jan 1, 1988
44.213
-1.049
-2.32%
jan 1, 1989
53.298
+9.085
20.55%
jan 1, 1990
64.653
+11.354
21.3%
jan 1, 1991
43.56
-21.092
-32.62%
jan 1, 1992
44.19
+0.63
1.45%
jan 1, 1993
51.872
+7.681
17.38%
jan 1, 1994
52.619
+0.747
1.44%
jan 1, 1995
47.246
-5.373
-10.21%
jan 1, 1996
48.079
+0.833
1.76%
jan 1, 1997
51.597
+3.517
7.32%
jan 1, 1998
55.508
+3.912
7.58%
jan 1, 1999
59.381
+3.873
6.98%
jan 1, 2000
66.556
+7.175
12.08%
jan 1, 2001
65.867
-0.689
-1.04%
jan 1, 2002
74.216
+8.349
12.67%
jan 1, 2003
78.617
+4.401
5.93%
jan 1, 2004
82.16
+3.543
4.51%
jan 1, 2005
79.113
-3.047
-3.71%
jan 1, 2006
79.333
+0.22
0.28%
jan 1, 2007
83.43
+4.097
5.16%
jan 1, 2008
83.641
+0.211
0.25%
jan 1, 2009
85.0
+1.358
1.62%
jan 1, 2010
105.25
+20.25
23.82%
jan 1, 2011
105.127
-0.122
-0.12%
jan 1, 2012
106.316
+1.188
1.13%
jan 1, 2013
114.204
+7.889
7.42%
jan 1, 2014
120.112
+5.908
5.17%
jan 1, 2015
128.456
+8.343
6.95%
jan 1, 2016
145.067
+16.611
12.93%
Ranking of countries by current statistics by years


Comments: