29
/
en
AIzaSyAYiBZKx7MnpbEhh9jyipgxe19OcubqV5w
April 1, 2024
121810
Dominican Republic
DOM
true
2
1
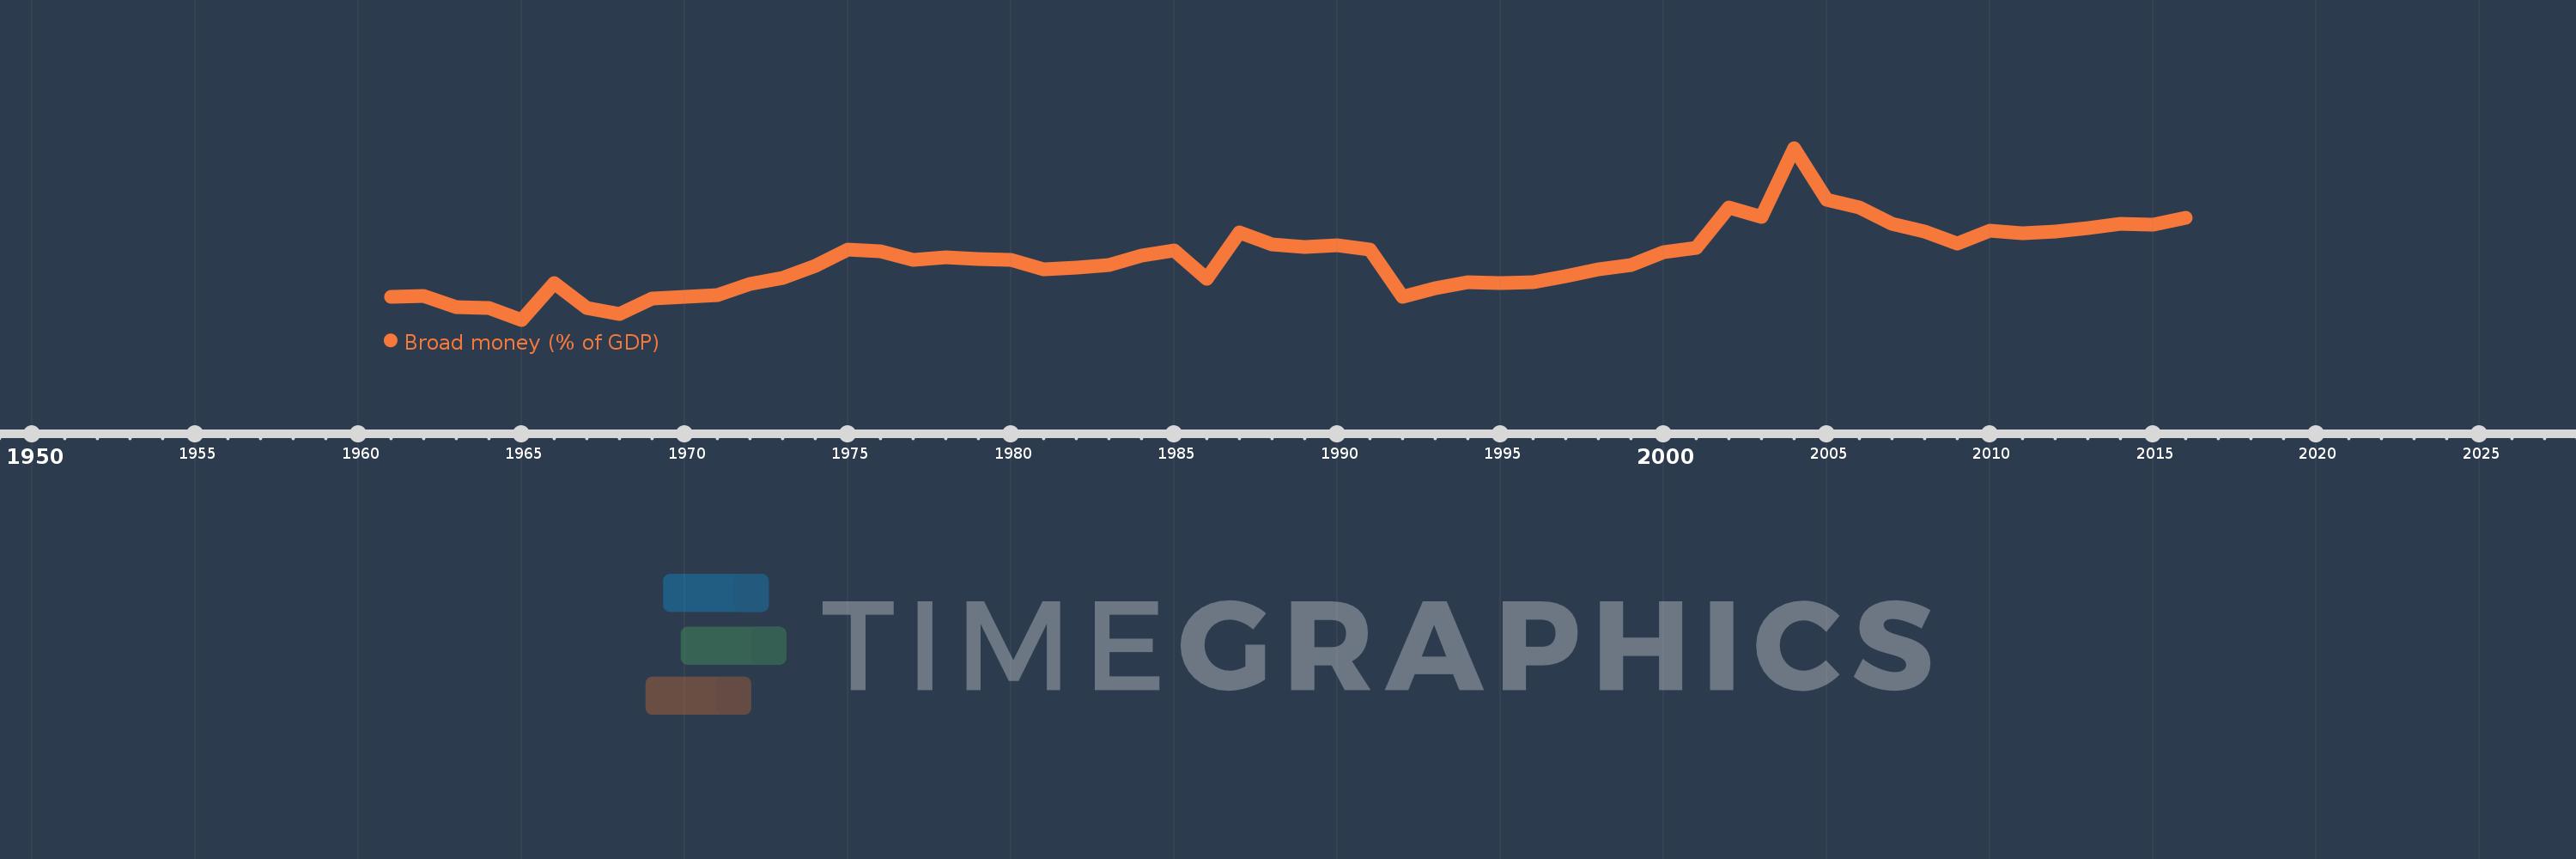
Broad money (% of GDP)
2016,2015,2014,2013,2012,2011,2010,2009,2008,2007,2006,2005,2004,2003,2002,2001,2000,1999,1998,1997,1996,1995,1994,1993,1992,1991,1990,1989,1988,1987,1986,1985,1984,1983,1982,1981,1980,1979,1978,1977,1976,1975,1974,1973,1972,1971,1970,1969,1968,1967,1966,1965,1964,1963,1962,1961
This statistics in other country:
AfghanistanAlbaniaAlgeriaAngolaAntigua and BarbudaArab WorldArgentinaArmeniaArubaAustraliaAzerbaijanBahamas, TheBahrainBangladeshBarbadosBelarusBelizeBeninBhutanBoliviaBosnia and HerzegovinaBotswanaBrazilBrunei DarussalamBulgariaBurkina FasoBurundiCabo VerdeCambodiaCameroonCanadaCaribbean small statesCentral African RepublicCentral Europe and the BalticsChadChileChinaColombiaComorosCongo, Dem. Rep.Congo, Rep.Costa RicaCote d'IvoireCroatiaCzech RepublicDenmarkDjiboutiDominicaDominican RepublicEarly-demographic dividendEast Asia & PacificEast Asia & Pacific (excluding high income)East Asia & Pacific (IDA & IBRD countries)EcuadorEgypt, Arab Rep.El SalvadorEquatorial GuineaEritreaEstoniaEthiopiaEurope & Central Asia (excluding high income)Europe & Central Asia (IDA & IBRD countries)FijiFragile and conflict affected situationsGabonGambia, TheGeorgiaGhanaGrenadaGuatemalaGuineaGuinea-BissauGuyanaHaitiHeavily indebted poor countries (HIPC)High incomeHondurasHong Kong SAR, ChinaHungaryIBRD onlyIcelandIDA & IBRD totalIDA blendIDA onlyIDA totalIndiaIndonesiaIran, Islamic Rep.IraqIsraelJamaicaJapanJordanKazakhstanKenyaKorea, Rep.KuwaitKyrgyz RepublicLao PDRLate-demographic dividendLatin America & Caribbean Latin America & Caribbean (excluding high income)Latin America & the Caribbean (IDA & IBRD countries)LatviaLeast developed countries: UN classificationLebanonLesothoLiberiaLibyaLithuaniaLow & middle incomeLow incomeLower middle incomeMacao SAR, ChinaMacedonia, FYRMadagascarMalawiMalaysiaMaldivesMaliMauritaniaMauritiusMexicoMicronesia, Fed. Sts.Middle East & North AfricaMiddle East & North Africa (excluding high income)Middle East & North Africa (IDA & IBRD countries)Middle incomeMoldovaMongoliaMoroccoMozambiqueMyanmarNamibiaNepalNew ZealandNicaraguaNigerNigeriaNorth AmericaNorwayOECD membersOmanOther small statesPacific island small statesPakistanPanamaPapua New GuineaParaguayPeruPhilippinesPolandPost-demographic dividendPre-demographic dividendQatarRomaniaRussian FederationRwandaSamoaSao Tome and PrincipeSaudi ArabiaSenegalSerbiaSeychellesSierra LeoneSingaporeSlovak RepublicSmall statesSolomon IslandsSouth AfricaSouth AsiaSouth Asia (IDA & IBRD)South SudanSri LankaSt. Kitts and NevisSt. LuciaSt. Vincent and the GrenadinesSub-Saharan Africa Sub-Saharan Africa (excluding high income)Sub-Saharan Africa (IDA & IBRD countries)SudanSurinameSwazilandSwedenSwitzerlandSyrian Arab RepublicTajikistanTanzaniaThailandTimor-LesteTogoTongaTrinidad and TobagoTunisiaTurkeyUgandaUkraineUnited Arab EmiratesUnited KingdomUnited StatesUpper middle incomeUruguayVanuatuVenezuela, RBVietnamWest Bank and GazaWorldYemen, Rep.ZambiaZimbabwe Timeline:
This timeline shows a graph from 1961 to 2016 of Dominican Republic. No data until 1960. Number of actual observations by date: 56.
Source name:
World Development Indicators
Source organization:
International Monetary Fund, International Financial Statistics and data files, and World Bank and OECD GDP estimates.
Categories, topics:
Financial Sector
Last updated:
apr 23, 2017
Indicators value changes by year
Minimum:
14.372
jan 1, 1965
Maximum:
50.181
jan 1, 2004
At the date of observation
Value
Absolute change
Change from previous value
jan 1, 1961
19.2
+19.2
0.0%
jan 1, 1962
19.324
+0.124
0.65%
jan 1, 1963
16.988
-2.336
-12.09%
jan 1, 1964
16.741
-0.247
-1.45%
jan 1, 1965
14.372
-2.369
-14.15%
jan 1, 1966
22.043
+7.67
53.37%
jan 1, 1967
16.815
-5.228
-23.72%
jan 1, 1968
15.632
-1.183
-7.03%
jan 1, 1969
18.877
+3.245
20.76%
jan 1, 1970
19.21
+0.333
1.77%
jan 1, 1971
19.458
+0.248
1.29%
jan 1, 1972
21.855
+2.397
12.32%
jan 1, 1973
23.175
+1.32
6.04%
jan 1, 1974
25.554
+2.38
10.27%
jan 1, 1975
29.034
+3.48
13.62%
jan 1, 1976
28.569
-0.465
-1.6%
jan 1, 1977
26.921
-1.648
-5.77%
jan 1, 1978
27.356
+0.436
1.62%
jan 1, 1979
27.076
-0.281
-1.03%
jan 1, 1980
26.824
-0.251
-0.93%
jan 1, 1981
24.896
-1.928
-7.19%
jan 1, 1982
25.205
+0.309
1.24%
jan 1, 1983
25.79
+0.584
2.32%
jan 1, 1984
27.835
+2.045
7.93%
jan 1, 1985
28.818
+0.983
3.53%
jan 1, 1986
22.965
-5.853
-20.31%
jan 1, 1987
32.536
+9.571
41.68%
jan 1, 1988
30.031
-2.505
-7.7%
jan 1, 1989
29.529
-0.503
-1.67%
jan 1, 1990
29.952
+0.423
1.43%
jan 1, 1991
29.065
-0.887
-2.96%
jan 1, 1992
19.24
-9.825
-33.8%
jan 1, 1993
20.917
+1.677
8.72%
jan 1, 1994
22.218
+1.3
6.22%
jan 1, 1995
21.967
-0.251
-1.13%
jan 1, 1996
22.201
+0.235
1.07%
jan 1, 1997
23.468
+1.267
5.7%
jan 1, 1998
24.819
+1.352
5.76%
jan 1, 1999
25.759
+0.939
3.78%
jan 1, 2000
28.434
+2.676
10.39%
jan 1, 2001
29.4
+0.966
3.4%
jan 1, 2002
37.795
+8.395
28.56%
jan 1, 2003
35.731
-2.064
-5.46%
jan 1, 2004
50.181
+14.45
40.44%
jan 1, 2005
39.456
-10.725
-21.37%
jan 1, 2006
37.778
-1.677
-4.25%
jan 1, 2007
34.318
-3.46
-9.16%
jan 1, 2008
32.795
-1.523
-4.44%
jan 1, 2009
30.342
-2.453
-7.48%
jan 1, 2010
32.971
+2.629
8.67%
jan 1, 2011
32.44
-0.531
-1.61%
jan 1, 2012
32.787
+0.347
1.07%
jan 1, 2013
33.387
+0.601
1.83%
jan 1, 2014
34.398
+1.011
3.03%
jan 1, 2015
34.278
-0.12
-0.35%
jan 1, 2016
35.575
+1.297
3.78%
Ranking of countries by current statistics by years


Comments: