29
/
en
AIzaSyAYiBZKx7MnpbEhh9jyipgxe19OcubqV5w
April 1, 2024
136449
Gambia, The
GMB
true
2
1
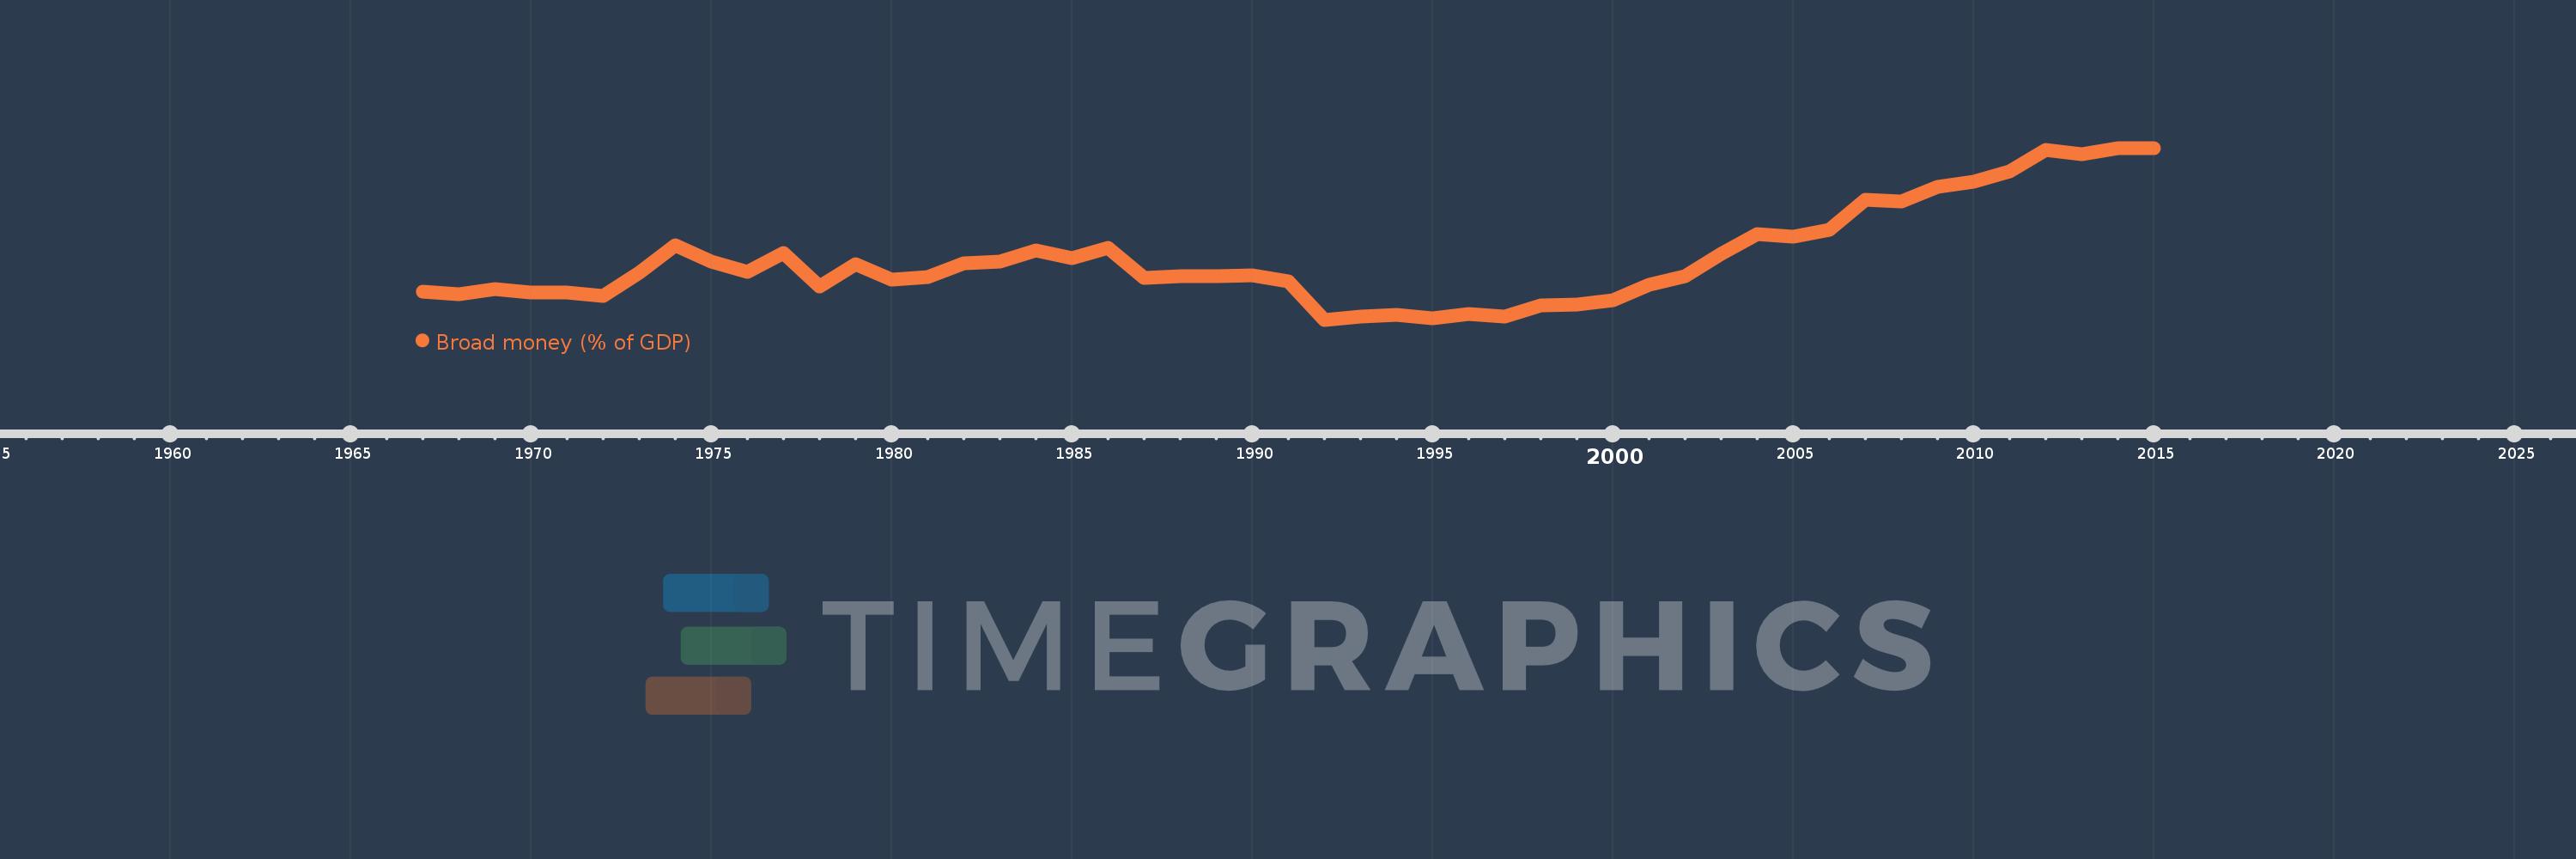
Broad money (% of GDP)
2015,2014,2013,2012,2011,2010,2009,2008,2007,2006,2005,2004,2003,2002,2001,2000,1999,1998,1997,1996,1995,1994,1993,1992,1991,1990,1989,1988,1987,1986,1985,1984,1983,1982,1981,1980,1979,1978,1977,1976,1975,1974,1973,1972,1971,1970,1969,1968,1967
This statistics in other country:
AfghanistanAlbaniaAlgeriaAngolaAntigua and BarbudaArab WorldArgentinaArmeniaArubaAustraliaAzerbaijanBahamas, TheBahrainBangladeshBarbadosBelarusBelizeBeninBhutanBoliviaBosnia and HerzegovinaBotswanaBrazilBrunei DarussalamBulgariaBurkina FasoBurundiCabo VerdeCambodiaCameroonCanadaCaribbean small statesCentral African RepublicCentral Europe and the BalticsChadChileChinaColombiaComorosCongo, Dem. Rep.Congo, Rep.Costa RicaCote d'IvoireCroatiaCzech RepublicDenmarkDjiboutiDominicaDominican RepublicEarly-demographic dividendEast Asia & PacificEast Asia & Pacific (excluding high income)East Asia & Pacific (IDA & IBRD countries)EcuadorEgypt, Arab Rep.El SalvadorEquatorial GuineaEritreaEstoniaEthiopiaEurope & Central Asia (excluding high income)Europe & Central Asia (IDA & IBRD countries)FijiFragile and conflict affected situationsGabonGambia, TheGeorgiaGhanaGrenadaGuatemalaGuineaGuinea-BissauGuyanaHaitiHeavily indebted poor countries (HIPC)High incomeHondurasHong Kong SAR, ChinaHungaryIBRD onlyIcelandIDA & IBRD totalIDA blendIDA onlyIDA totalIndiaIndonesiaIran, Islamic Rep.IraqIsraelJamaicaJapanJordanKazakhstanKenyaKorea, Rep.KuwaitKyrgyz RepublicLao PDRLate-demographic dividendLatin America & Caribbean Latin America & Caribbean (excluding high income)Latin America & the Caribbean (IDA & IBRD countries)LatviaLeast developed countries: UN classificationLebanonLesothoLiberiaLibyaLithuaniaLow & middle incomeLow incomeLower middle incomeMacao SAR, ChinaMacedonia, FYRMadagascarMalawiMalaysiaMaldivesMaliMauritaniaMauritiusMexicoMicronesia, Fed. Sts.Middle East & North AfricaMiddle East & North Africa (excluding high income)Middle East & North Africa (IDA & IBRD countries)Middle incomeMoldovaMongoliaMoroccoMozambiqueMyanmarNamibiaNepalNew ZealandNicaraguaNigerNigeriaNorth AmericaNorwayOECD membersOmanOther small statesPacific island small statesPakistanPanamaPapua New GuineaParaguayPeruPhilippinesPolandPost-demographic dividendPre-demographic dividendQatarRomaniaRussian FederationRwandaSamoaSao Tome and PrincipeSaudi ArabiaSenegalSerbiaSeychellesSierra LeoneSingaporeSlovak RepublicSmall statesSolomon IslandsSouth AfricaSouth AsiaSouth Asia (IDA & IBRD)South SudanSri LankaSt. Kitts and NevisSt. LuciaSt. Vincent and the GrenadinesSub-Saharan Africa Sub-Saharan Africa (excluding high income)Sub-Saharan Africa (IDA & IBRD countries)SudanSurinameSwazilandSwedenSwitzerlandSyrian Arab RepublicTajikistanTanzaniaThailandTimor-LesteTogoTongaTrinidad and TobagoTunisiaTurkeyUgandaUkraineUnited Arab EmiratesUnited KingdomUnited StatesUpper middle incomeUruguayVanuatuVenezuela, RBVietnamWest Bank and GazaWorldYemen, Rep.ZambiaZimbabwe Timeline:
This timeline shows a graph from 1967 to 2015 of Gambia, The. No data until 1966. Number of actual observations by date: 49.
Source name:
World Development Indicators
Source organization:
International Monetary Fund, International Financial Statistics and data files, and World Bank and OECD GDP estimates.
Categories, topics:
Financial Sector
Last updated:
apr 23, 2017
Indicators value changes by year
Minimum:
10.761
jan 1, 1992
At the date of observation
Value
Absolute change
Change from previous value
jan 1, 1967
17.935
+17.935
0.0%
jan 1, 1968
17.293
-0.643
-3.58%
jan 1, 1969
18.694
+1.401
8.1%
jan 1, 1970
17.8
-0.894
-4.78%
jan 1, 1971
17.779
-0.021
-0.12%
jan 1, 1972
16.996
-0.783
-4.41%
jan 1, 1973
22.838
+5.842
34.37%
jan 1, 1974
30.047
+7.209
31.57%
jan 1, 1975
25.778
-4.269
-14.21%
jan 1, 1976
23.006
-2.772
-10.75%
jan 1, 1977
28.002
+4.996
21.71%
jan 1, 1978
19.406
-8.595
-30.7%
jan 1, 1979
25.022
+5.616
28.94%
jan 1, 1980
21.014
-4.008
-16.02%
jan 1, 1981
21.861
+0.846
4.03%
jan 1, 1982
25.187
+3.326
15.22%
jan 1, 1983
25.679
+0.492
1.95%
jan 1, 1984
28.58
+2.901
11.3%
jan 1, 1985
26.712
-1.868
-6.54%
jan 1, 1986
29.234
+2.522
9.44%
jan 1, 1987
21.441
-7.793
-26.66%
jan 1, 1988
22.01
+0.569
2.66%
jan 1, 1989
22.035
+0.025
0.11%
jan 1, 1990
22.1
+0.065
0.3%
jan 1, 1991
20.658
-1.442
-6.53%
jan 1, 1992
10.761
-9.897
-47.91%
jan 1, 1993
11.62
+0.859
7.98%
jan 1, 1994
12.098
+0.478
4.11%
jan 1, 1995
11.199
-0.899
-7.43%
jan 1, 1996
12.196
+0.997
8.9%
jan 1, 1997
11.646
-0.55
-4.51%
jan 1, 1998
14.518
+2.872
24.67%
jan 1, 1999
14.666
+0.148
1.02%
jan 1, 2000
15.837
+1.172
7.99%
jan 1, 2001
19.801
+3.963
25.03%
jan 1, 2002
21.953
+2.153
10.87%
jan 1, 2003
27.806
+5.853
26.66%
jan 1, 2004
32.899
+5.092
18.31%
jan 1, 2005
32.206
-0.693
-2.11%
jan 1, 2006
33.911
+1.705
5.29%
jan 1, 2007
41.664
+7.753
22.86%
jan 1, 2008
41.162
-0.502
-1.21%
jan 1, 2009
45.091
+3.929
9.54%
jan 1, 2010
46.243
+1.153
2.56%
jan 1, 2011
49.014
+2.771
5.99%
jan 1, 2012
54.582
+5.568
11.36%
jan 1, 2013
53.285
-1.297
-2.38%
jan 1, 2014
55.01
+1.725
3.24%
jan 1, 2015
54.991
-0.019
-0.04%
Ranking of countries by current statistics by years


Comments: