29
/
en
AIzaSyAYiBZKx7MnpbEhh9jyipgxe19OcubqV5w
April 1, 2024
23928
Arab World
ARB
false
2
1
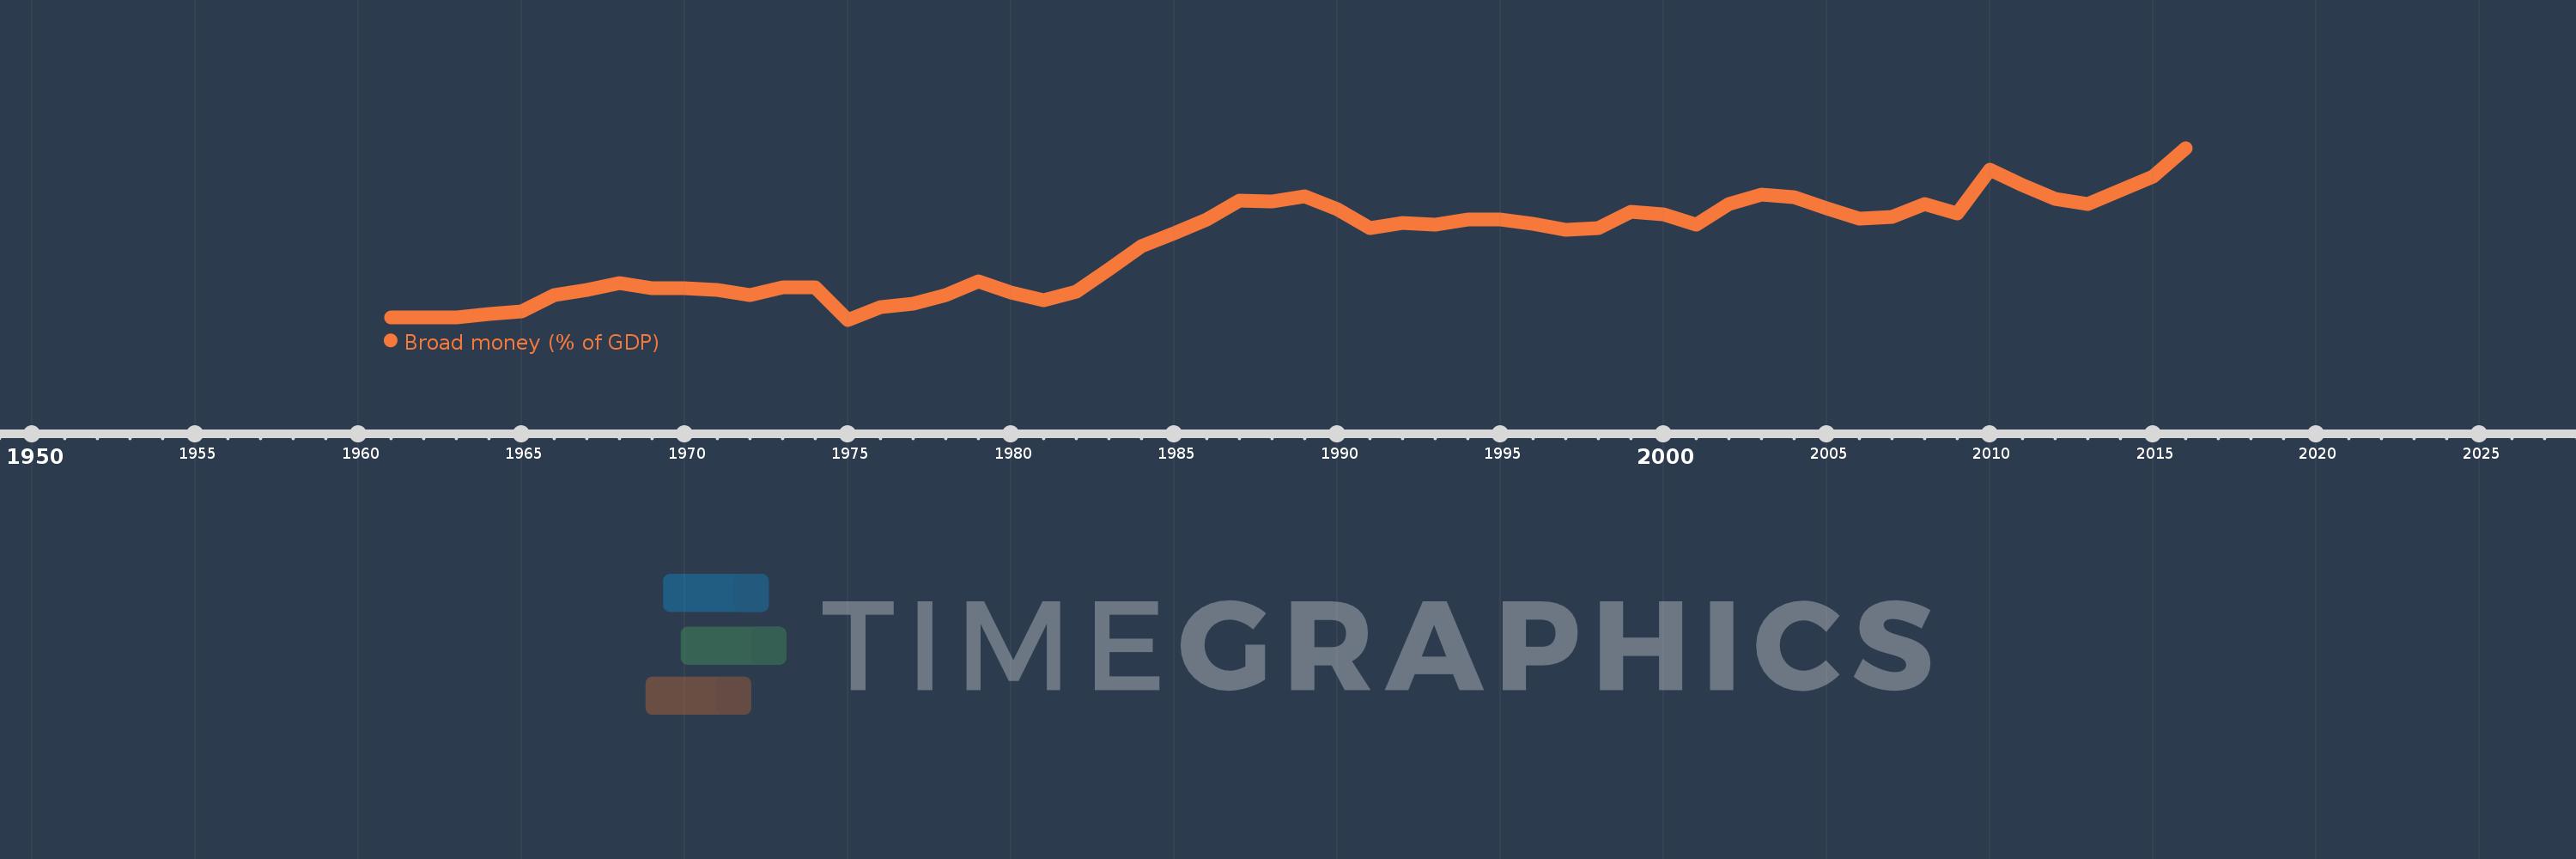
Broad money (% of GDP)
2016,2015,2014,2013,2012,2011,2010,2009,2008,2007,2006,2005,2004,2003,2002,2001,2000,1999,1998,1997,1996,1995,1994,1993,1992,1991,1990,1989,1988,1987,1986,1985,1984,1983,1982,1981,1980,1979,1978,1977,1976,1975,1974,1973,1972,1971,1970,1969,1968,1967,1966,1965,1964,1963,1962,1961
This statistics in other country:
AfghanistanAlbaniaAlgeriaAngolaAntigua and BarbudaArab WorldArgentinaArmeniaArubaAustraliaAzerbaijanBahamas, TheBahrainBangladeshBarbadosBelarusBelizeBeninBhutanBoliviaBosnia and HerzegovinaBotswanaBrazilBrunei DarussalamBulgariaBurkina FasoBurundiCabo VerdeCambodiaCameroonCanadaCaribbean small statesCentral African RepublicCentral Europe and the BalticsChadChileChinaColombiaComorosCongo, Dem. Rep.Congo, Rep.Costa RicaCote d'IvoireCroatiaCzech RepublicDenmarkDjiboutiDominicaDominican RepublicEarly-demographic dividendEast Asia & PacificEast Asia & Pacific (excluding high income)East Asia & Pacific (IDA & IBRD countries)EcuadorEgypt, Arab Rep.El SalvadorEquatorial GuineaEritreaEstoniaEthiopiaEurope & Central Asia (excluding high income)Europe & Central Asia (IDA & IBRD countries)FijiFragile and conflict affected situationsGabonGambia, TheGeorgiaGhanaGrenadaGuatemalaGuineaGuinea-BissauGuyanaHaitiHeavily indebted poor countries (HIPC)High incomeHondurasHong Kong SAR, ChinaHungaryIBRD onlyIcelandIDA & IBRD totalIDA blendIDA onlyIDA totalIndiaIndonesiaIran, Islamic Rep.IraqIsraelJamaicaJapanJordanKazakhstanKenyaKorea, Rep.KuwaitKyrgyz RepublicLao PDRLate-demographic dividendLatin America & Caribbean Latin America & Caribbean (excluding high income)Latin America & the Caribbean (IDA & IBRD countries)LatviaLeast developed countries: UN classificationLebanonLesothoLiberiaLibyaLithuaniaLow & middle incomeLow incomeLower middle incomeMacao SAR, ChinaMacedonia, FYRMadagascarMalawiMalaysiaMaldivesMaliMauritaniaMauritiusMexicoMicronesia, Fed. Sts.Middle East & North AfricaMiddle East & North Africa (excluding high income)Middle East & North Africa (IDA & IBRD countries)Middle incomeMoldovaMongoliaMoroccoMozambiqueMyanmarNamibiaNepalNew ZealandNicaraguaNigerNigeriaNorth AmericaNorwayOECD membersOmanOther small statesPacific island small statesPakistanPanamaPapua New GuineaParaguayPeruPhilippinesPolandPost-demographic dividendPre-demographic dividendQatarRomaniaRussian FederationRwandaSamoaSao Tome and PrincipeSaudi ArabiaSenegalSerbiaSeychellesSierra LeoneSingaporeSlovak RepublicSmall statesSolomon IslandsSouth AfricaSouth AsiaSouth Asia (IDA & IBRD)South SudanSri LankaSt. Kitts and NevisSt. LuciaSt. Vincent and the GrenadinesSub-Saharan Africa Sub-Saharan Africa (excluding high income)Sub-Saharan Africa (IDA & IBRD countries)SudanSurinameSwazilandSwedenSwitzerlandSyrian Arab RepublicTajikistanTanzaniaThailandTimor-LesteTogoTongaTrinidad and TobagoTunisiaTurkeyUgandaUkraineUnited Arab EmiratesUnited KingdomUnited StatesUpper middle incomeUruguayVanuatuVenezuela, RBVietnamWest Bank and GazaWorldYemen, Rep.ZambiaZimbabwe Timeline:
This timeline shows a graph from 1961 to 2016 of Arab World. No data until 1960. Number of actual observations by date: 56.
Source name:
World Development Indicators
Source organization:
International Monetary Fund, International Financial Statistics and data files, and World Bank and OECD GDP estimates.
Categories, topics:
Financial Sector
Last updated:
apr 23, 2017
Indicators value changes by year
Minimum:
21.647
jan 1, 1975
At the date of observation
Value
Absolute change
Change from previous value
jan 1, 1961
22.496
+22.496
0.0%
jan 1, 1962
22.501
+0.006
0.02%
jan 1, 1963
22.436
-0.066
-0.29%
jan 1, 1964
23.566
+1.131
5.04%
jan 1, 1965
24.465
+0.899
3.81%
jan 1, 1966
29.933
+5.468
22.35%
jan 1, 1967
31.778
+1.844
6.16%
jan 1, 1968
34.108
+2.33
7.33%
jan 1, 1969
32.355
-1.753
-5.14%
jan 1, 1970
32.454
+0.099
0.31%
jan 1, 1971
31.754
-0.7
-2.16%
jan 1, 1972
29.907
-1.848
-5.82%
jan 1, 1973
32.582
+2.675
8.95%
jan 1, 1974
32.757
+0.175
0.54%
jan 1, 1975
21.647
-11.11
-33.92%
jan 1, 1976
25.896
+4.249
19.63%
jan 1, 1977
27.127
+1.232
4.76%
jan 1, 1978
29.958
+2.831
10.43%
jan 1, 1979
34.746
+4.788
15.98%
jan 1, 1980
30.787
-3.959
-11.39%
jan 1, 1981
28.201
-2.586
-8.4%
jan 1, 1982
31.157
+2.956
10.48%
jan 1, 1983
38.891
+7.735
24.83%
jan 1, 1984
46.551
+7.66
19.7%
jan 1, 1985
50.889
+4.338
9.32%
jan 1, 1986
55.567
+4.678
9.19%
jan 1, 1987
62.159
+6.592
11.86%
jan 1, 1988
61.692
-0.466
-0.75%
jan 1, 1989
63.619
+1.926
3.12%
jan 1, 1990
59.185
-4.434
-6.97%
jan 1, 1991
52.65
-6.535
-11.04%
jan 1, 1992
54.428
+1.778
3.38%
jan 1, 1993
53.964
-0.464
-0.85%
jan 1, 1994
55.642
+1.678
3.11%
jan 1, 1995
55.579
-0.063
-0.11%
jan 1, 1996
54.209
-1.37
-2.47%
jan 1, 1997
52.262
-1.946
-3.59%
jan 1, 1998
52.901
+0.639
1.22%
jan 1, 1999
58.393
+5.492
10.38%
jan 1, 2000
57.543
-0.85
-1.46%
jan 1, 2001
53.941
-3.601
-6.26%
jan 1, 2002
60.872
+6.931
12.85%
jan 1, 2003
64.15
+3.278
5.38%
jan 1, 2004
63.263
-0.887
-1.38%
jan 1, 2005
59.477
-3.785
-5.98%
jan 1, 2006
55.881
-3.596
-6.05%
jan 1, 2007
56.532
+0.651
1.16%
jan 1, 2008
60.934
+4.402
7.79%
jan 1, 2009
57.715
-3.219
-5.28%
jan 1, 2010
72.686
+14.971
25.94%
jan 1, 2011
67.32
-5.366
-7.38%
jan 1, 2012
62.719
-4.602
-6.84%
jan 1, 2013
61.071
-1.648
-2.63%
jan 1, 2014
65.601
+4.53
7.42%
jan 1, 2015
70.253
+4.652
7.09%
jan 1, 2016
79.97
+9.717
13.83%
Ranking of countries by current statistics by years


Comments: