29
/
en
AIzaSyAYiBZKx7MnpbEhh9jyipgxe19OcubqV5w
April 1, 2024
257078
Switzerland
CHE
true
2
1
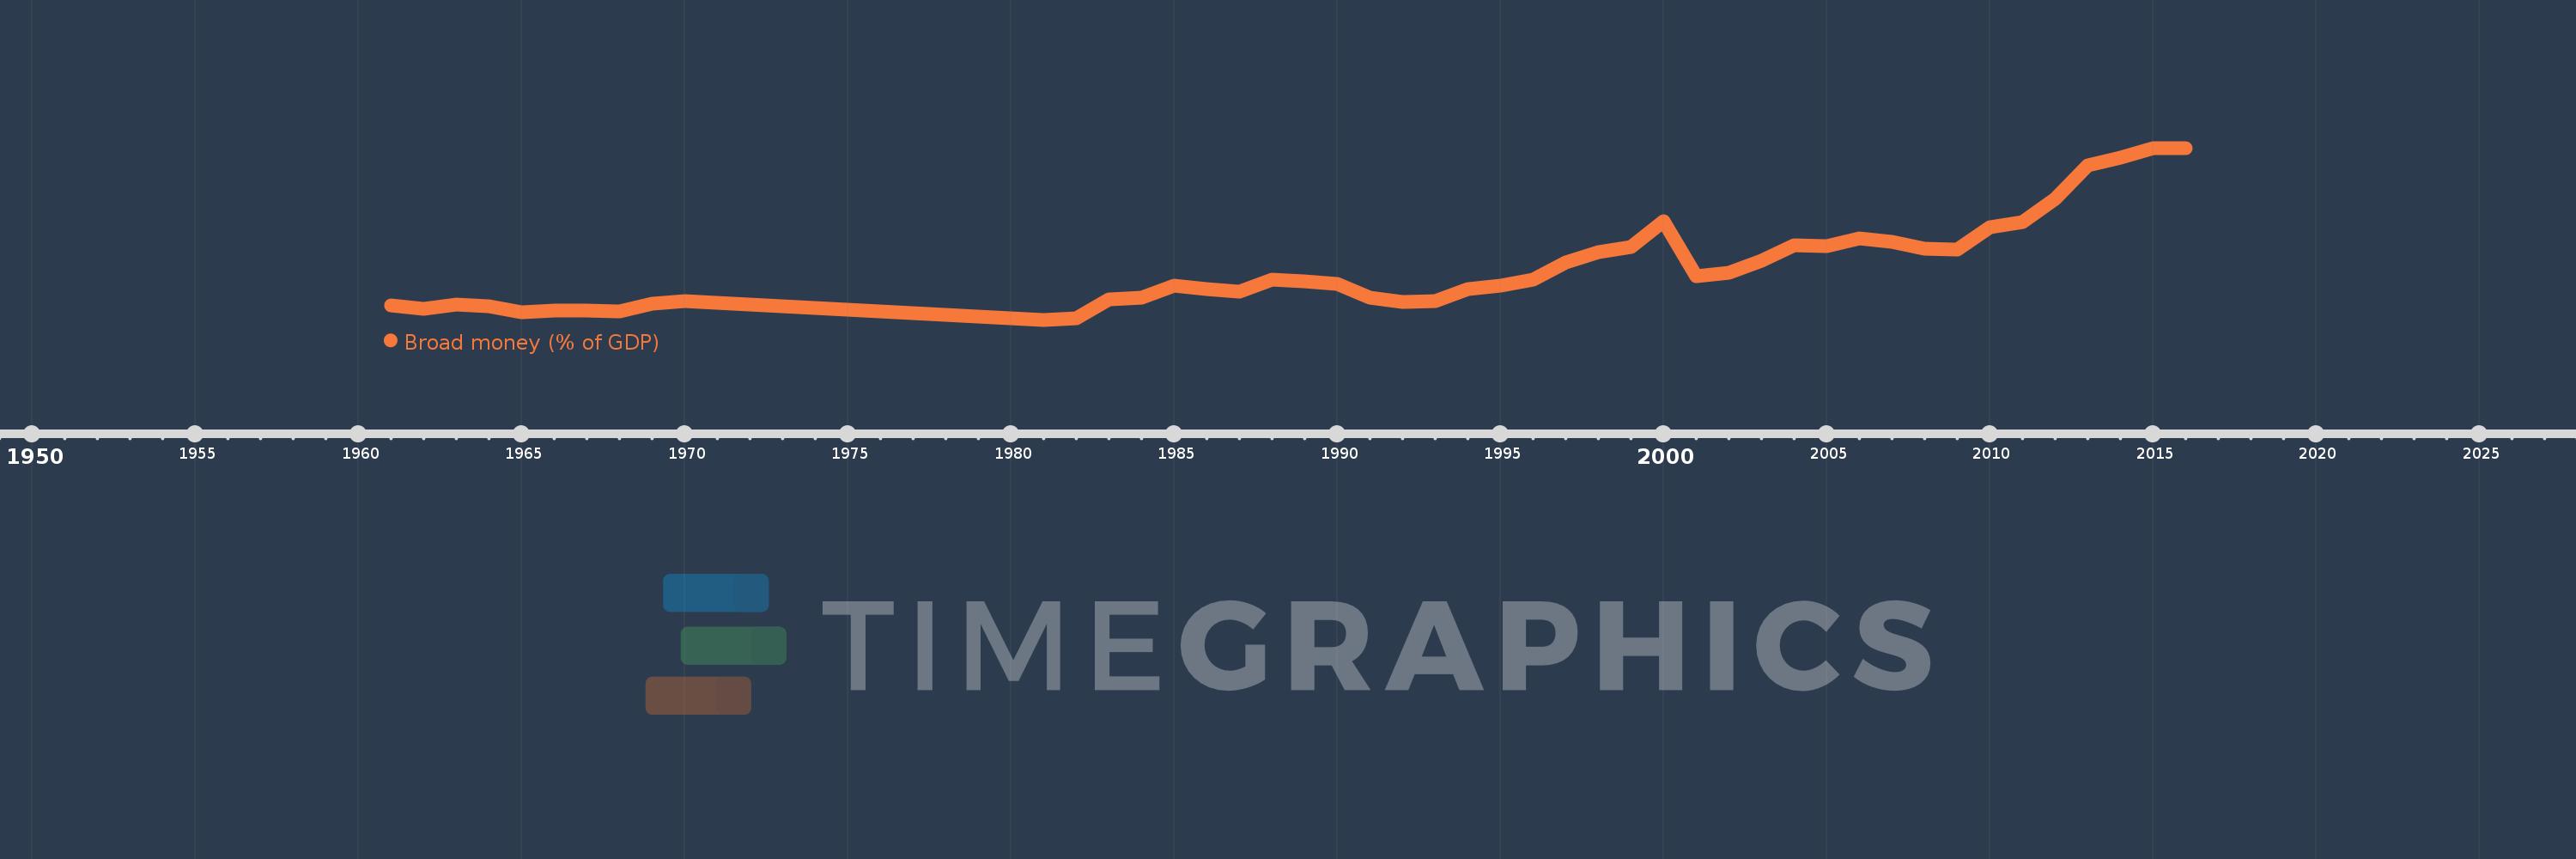
Broad money (% of GDP)
2016,2015,2014,2013,2012,2011,2010,2009,2008,2007,2006,2005,2004,2003,2002,2001,2000,1999,1998,1997,1996,1995,1994,1993,1992,1991,1990,1989,1988,1987,1986,1985,1984,1983,1982,1981,1970,1969,1968,1967,1966,1965,1964,1963,1962,1961
This statistics in other country:
AfghanistanAlbaniaAlgeriaAngolaAntigua and BarbudaArab WorldArgentinaArmeniaArubaAustraliaAzerbaijanBahamas, TheBahrainBangladeshBarbadosBelarusBelizeBeninBhutanBoliviaBosnia and HerzegovinaBotswanaBrazilBrunei DarussalamBulgariaBurkina FasoBurundiCabo VerdeCambodiaCameroonCanadaCaribbean small statesCentral African RepublicCentral Europe and the BalticsChadChileChinaColombiaComorosCongo, Dem. Rep.Congo, Rep.Costa RicaCote d'IvoireCroatiaCzech RepublicDenmarkDjiboutiDominicaDominican RepublicEarly-demographic dividendEast Asia & PacificEast Asia & Pacific (excluding high income)East Asia & Pacific (IDA & IBRD countries)EcuadorEgypt, Arab Rep.El SalvadorEquatorial GuineaEritreaEstoniaEthiopiaEurope & Central Asia (excluding high income)Europe & Central Asia (IDA & IBRD countries)FijiFragile and conflict affected situationsGabonGambia, TheGeorgiaGhanaGrenadaGuatemalaGuineaGuinea-BissauGuyanaHaitiHeavily indebted poor countries (HIPC)High incomeHondurasHong Kong SAR, ChinaHungaryIBRD onlyIcelandIDA & IBRD totalIDA blendIDA onlyIDA totalIndiaIndonesiaIran, Islamic Rep.IraqIsraelJamaicaJapanJordanKazakhstanKenyaKorea, Rep.KuwaitKyrgyz RepublicLao PDRLate-demographic dividendLatin America & Caribbean Latin America & Caribbean (excluding high income)Latin America & the Caribbean (IDA & IBRD countries)LatviaLeast developed countries: UN classificationLebanonLesothoLiberiaLibyaLithuaniaLow & middle incomeLow incomeLower middle incomeMacao SAR, ChinaMacedonia, FYRMadagascarMalawiMalaysiaMaldivesMaliMauritaniaMauritiusMexicoMicronesia, Fed. Sts.Middle East & North AfricaMiddle East & North Africa (excluding high income)Middle East & North Africa (IDA & IBRD countries)Middle incomeMoldovaMongoliaMoroccoMozambiqueMyanmarNamibiaNepalNew ZealandNicaraguaNigerNigeriaNorth AmericaNorwayOECD membersOmanOther small statesPacific island small statesPakistanPanamaPapua New GuineaParaguayPeruPhilippinesPolandPost-demographic dividendPre-demographic dividendQatarRomaniaRussian FederationRwandaSamoaSao Tome and PrincipeSaudi ArabiaSenegalSerbiaSeychellesSierra LeoneSingaporeSlovak RepublicSmall statesSolomon IslandsSouth AfricaSouth AsiaSouth Asia (IDA & IBRD)South SudanSri LankaSt. Kitts and NevisSt. LuciaSt. Vincent and the GrenadinesSub-Saharan Africa Sub-Saharan Africa (excluding high income)Sub-Saharan Africa (IDA & IBRD countries)SudanSurinameSwazilandSwedenSwitzerlandSyrian Arab RepublicTajikistanTanzaniaThailandTimor-LesteTogoTongaTrinidad and TobagoTunisiaTurkeyUgandaUkraineUnited Arab EmiratesUnited KingdomUnited StatesUpper middle incomeUruguayVanuatuVenezuela, RBVietnamWest Bank and GazaWorldYemen, Rep.ZambiaZimbabwe Timeline:
This timeline shows a graph from 1961 to 2016 of Switzerland. No data until 1960. Number of actual observations by date: 46.
Source name:
World Development Indicators
Source organization:
International Monetary Fund, International Financial Statistics and data files, and World Bank and OECD GDP estimates.
Categories, topics:
Financial Sector
Last updated:
apr 23, 2017
Indicators value changes by year
Minimum:
90.621
jan 1, 1981
Maximum:
188.108
jan 1, 2015
At the date of observation
Value
Absolute change
Change from previous value
jan 1, 1961
98.76
+98.76
0.0%
jan 1, 1962
96.843
-1.917
-1.94%
jan 1, 1963
99.364
+2.521
2.6%
jan 1, 1964
98.346
-1.017
-1.02%
jan 1, 1965
94.941
-3.406
-3.46%
jan 1, 1966
96.009
+1.068
1.13%
jan 1, 1967
95.8
-0.208
-0.22%
jan 1, 1968
95.582
-0.218
-0.23%
jan 1, 1969
99.707
+4.125
4.32%
jan 1, 1970
101.216
+1.509
1.51%
jan 1, 1981
90.621
-10.596
-10.47%
jan 1, 1982
91.486
+0.865
0.95%
jan 1, 1983
102.401
+10.915
11.93%
jan 1, 1984
103.262
+0.862
0.84%
jan 1, 1985
109.913
+6.651
6.44%
jan 1, 1986
107.988
-1.925
-1.75%
jan 1, 1987
106.326
-1.663
-1.54%
jan 1, 1988
113.245
+6.919
6.51%
jan 1, 1989
112.461
-0.784
-0.69%
jan 1, 1990
110.736
-1.725
-1.53%
jan 1, 1991
102.963
-7.773
-7.02%
jan 1, 1992
100.88
-2.083
-2.02%
jan 1, 1993
101.391
+0.511
0.51%
jan 1, 1994
108.043
+6.652
6.56%
jan 1, 1995
109.822
+1.779
1.65%
jan 1, 1996
113.493
+3.671
3.34%
jan 1, 1997
123.35
+9.857
8.68%
jan 1, 1998
128.821
+5.471
4.44%
jan 1, 1999
131.681
+2.86
2.22%
jan 1, 2000
146.495
+14.813
11.25%
jan 1, 2001
115.508
-30.987
-21.15%
jan 1, 2002
117.109
+1.601
1.39%
jan 1, 2003
124.053
+6.944
5.93%
jan 1, 2004
133.096
+9.043
7.29%
jan 1, 2005
132.595
-0.501
-0.38%
jan 1, 2006
136.674
+4.079
3.08%
jan 1, 2007
134.823
-1.851
-1.35%
jan 1, 2008
130.814
-4.009
-2.97%
jan 1, 2009
130.537
-0.278
-0.21%
jan 1, 2010
142.934
+12.398
9.5%
jan 1, 2011
146.049
+3.115
2.18%
jan 1, 2012
159.249
+13.2
9.04%
jan 1, 2013
178.434
+19.185
12.05%
jan 1, 2014
182.44
+4.006
2.25%
jan 1, 2015
188.108
+5.668
3.11%
jan 1, 2016
187.741
-0.367
-0.2%
Ranking of countries by current statistics by years


Comments: