29
/
en
AIzaSyAYiBZKx7MnpbEhh9jyipgxe19OcubqV5w
April 1, 2024
45897
Low income
LIC
false
2
1
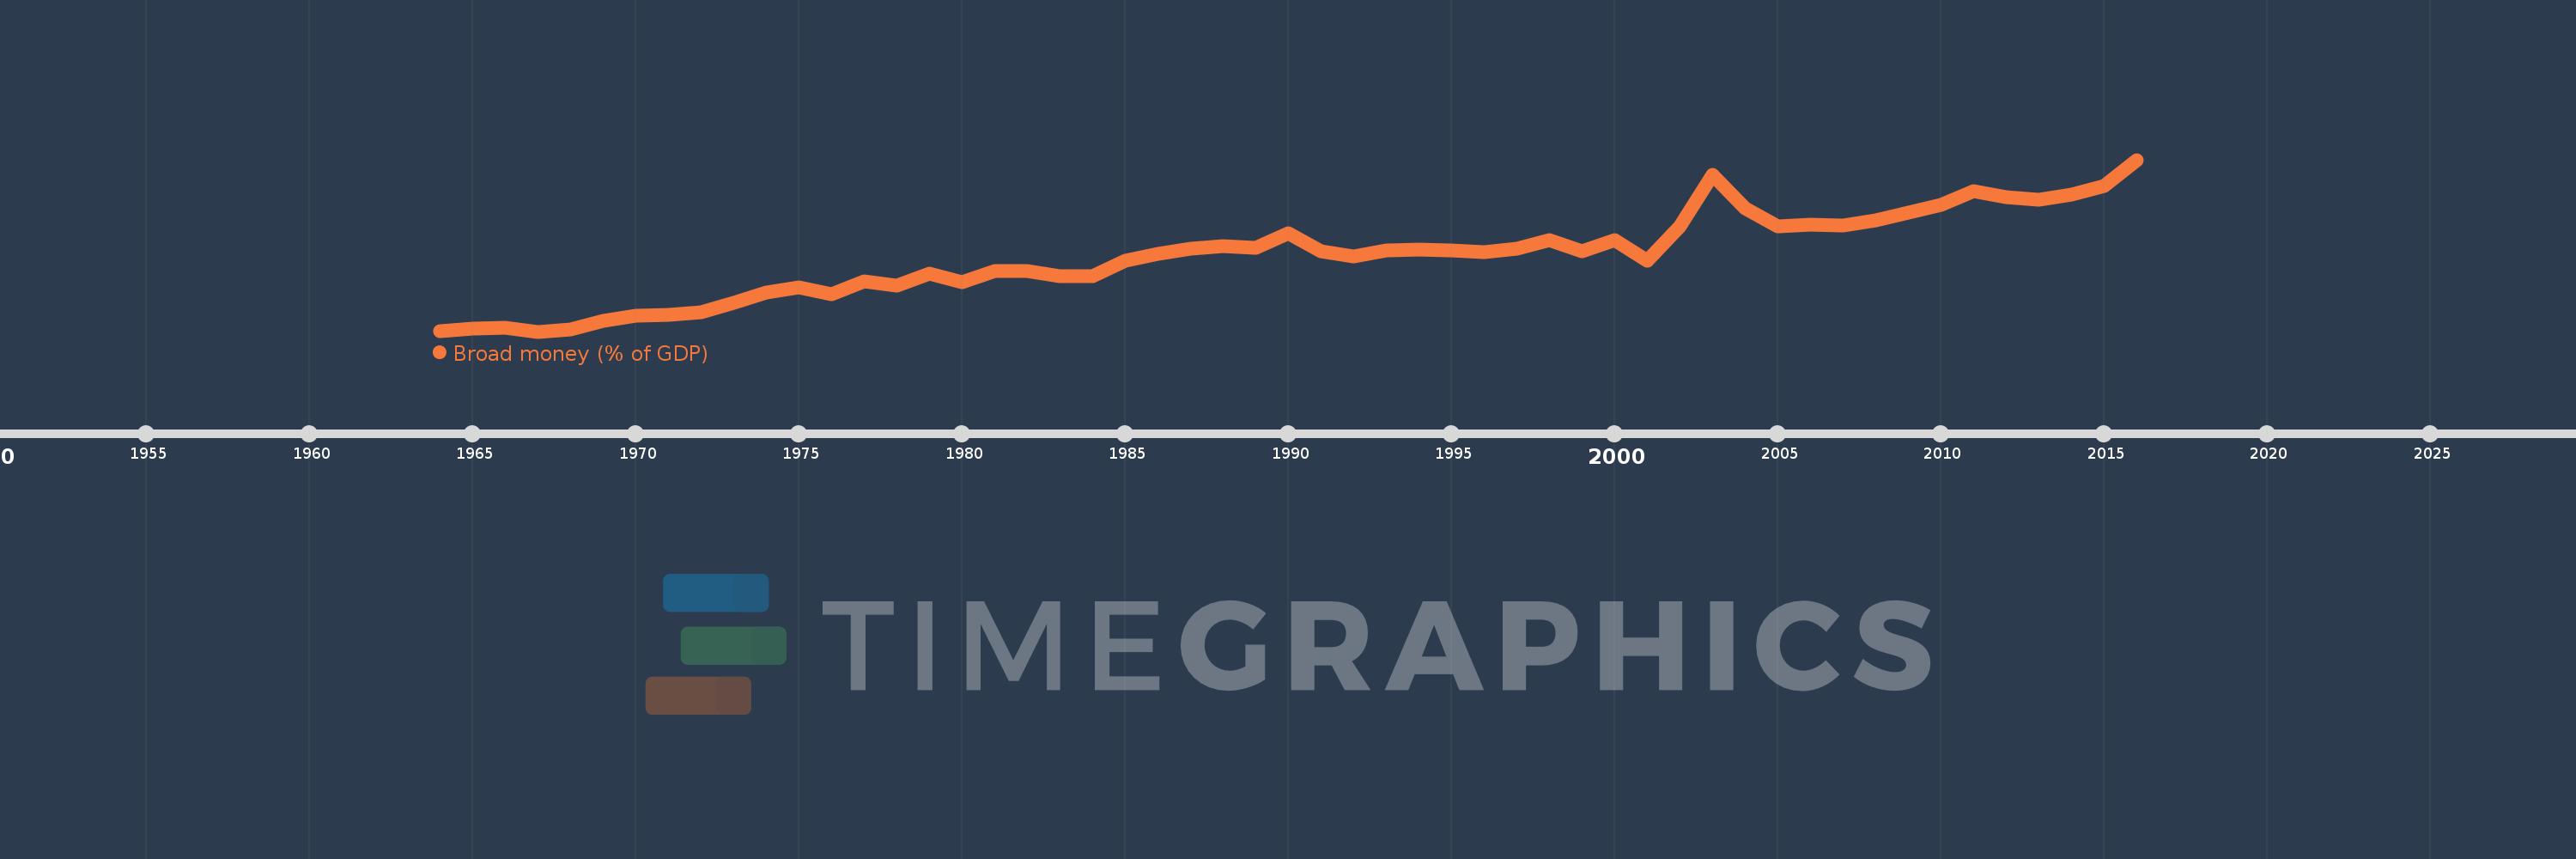
Broad money (% of GDP)
2016,2015,2014,2013,2012,2011,2010,2009,2008,2007,2006,2005,2004,2003,2002,2001,2000,1999,1998,1997,1996,1995,1994,1993,1992,1991,1990,1989,1988,1987,1986,1985,1984,1983,1982,1981,1980,1979,1978,1977,1976,1975,1974,1973,1972,1971,1970,1969,1968,1967,1966,1965,1964
This statistics in other country:
AfghanistanAlbaniaAlgeriaAngolaAntigua and BarbudaArab WorldArgentinaArmeniaArubaAustraliaAzerbaijanBahamas, TheBahrainBangladeshBarbadosBelarusBelizeBeninBhutanBoliviaBosnia and HerzegovinaBotswanaBrazilBrunei DarussalamBulgariaBurkina FasoBurundiCabo VerdeCambodiaCameroonCanadaCaribbean small statesCentral African RepublicCentral Europe and the BalticsChadChileChinaColombiaComorosCongo, Dem. Rep.Congo, Rep.Costa RicaCote d'IvoireCroatiaCzech RepublicDenmarkDjiboutiDominicaDominican RepublicEarly-demographic dividendEast Asia & PacificEast Asia & Pacific (excluding high income)East Asia & Pacific (IDA & IBRD countries)EcuadorEgypt, Arab Rep.El SalvadorEquatorial GuineaEritreaEstoniaEthiopiaEurope & Central Asia (excluding high income)Europe & Central Asia (IDA & IBRD countries)FijiFragile and conflict affected situationsGabonGambia, TheGeorgiaGhanaGrenadaGuatemalaGuineaGuinea-BissauGuyanaHaitiHeavily indebted poor countries (HIPC)High incomeHondurasHong Kong SAR, ChinaHungaryIBRD onlyIcelandIDA & IBRD totalIDA blendIDA onlyIDA totalIndiaIndonesiaIran, Islamic Rep.IraqIsraelJamaicaJapanJordanKazakhstanKenyaKorea, Rep.KuwaitKyrgyz RepublicLao PDRLate-demographic dividendLatin America & Caribbean Latin America & Caribbean (excluding high income)Latin America & the Caribbean (IDA & IBRD countries)LatviaLeast developed countries: UN classificationLebanonLesothoLiberiaLibyaLithuaniaLow & middle incomeLow incomeLower middle incomeMacao SAR, ChinaMacedonia, FYRMadagascarMalawiMalaysiaMaldivesMaliMauritaniaMauritiusMexicoMicronesia, Fed. Sts.Middle East & North AfricaMiddle East & North Africa (excluding high income)Middle East & North Africa (IDA & IBRD countries)Middle incomeMoldovaMongoliaMoroccoMozambiqueMyanmarNamibiaNepalNew ZealandNicaraguaNigerNigeriaNorth AmericaNorwayOECD membersOmanOther small statesPacific island small statesPakistanPanamaPapua New GuineaParaguayPeruPhilippinesPolandPost-demographic dividendPre-demographic dividendQatarRomaniaRussian FederationRwandaSamoaSao Tome and PrincipeSaudi ArabiaSenegalSerbiaSeychellesSierra LeoneSingaporeSlovak RepublicSmall statesSolomon IslandsSouth AfricaSouth AsiaSouth Asia (IDA & IBRD)South SudanSri LankaSt. Kitts and NevisSt. LuciaSt. Vincent and the GrenadinesSub-Saharan Africa Sub-Saharan Africa (excluding high income)Sub-Saharan Africa (IDA & IBRD countries)SudanSurinameSwazilandSwedenSwitzerlandSyrian Arab RepublicTajikistanTanzaniaThailandTimor-LesteTogoTongaTrinidad and TobagoTunisiaTurkeyUgandaUkraineUnited Arab EmiratesUnited KingdomUnited StatesUpper middle incomeUruguayVanuatuVenezuela, RBVietnamWest Bank and GazaWorldYemen, Rep.ZambiaZimbabwe Timeline:
This timeline shows a graph from 1964 to 2016 of Low income. No data until 1963. Number of actual observations by date: 53.
Source name:
World Development Indicators
Source organization:
International Monetary Fund, International Financial Statistics and data files, and World Bank and OECD GDP estimates.
Categories, topics:
Financial Sector
Last updated:
apr 23, 2017
Indicators value changes by year
Minimum:
10.899
jan 1, 1967
Maximum:
34.913
jan 1, 2016
At the date of observation
Value
Absolute change
Change from previous value
jan 1, 1964
10.972
+10.972
0.0%
jan 1, 1965
11.355
+0.383
3.49%
jan 1, 1966
11.425
+0.069
0.61%
jan 1, 1967
10.899
-0.526
-4.6%
jan 1, 1968
11.161
+0.262
2.41%
jan 1, 1969
12.419
+1.258
11.27%
jan 1, 1970
13.105
+0.686
5.52%
jan 1, 1971
13.264
+0.159
1.21%
jan 1, 1972
13.562
+0.298
2.24%
jan 1, 1973
14.927
+1.365
10.07%
jan 1, 1974
16.358
+1.431
9.59%
jan 1, 1975
17.115
+0.757
4.63%
jan 1, 1976
16.16
-0.955
-5.58%
jan 1, 1977
17.968
+1.808
11.19%
jan 1, 1978
17.36
-0.608
-3.38%
jan 1, 1979
19.037
+1.677
9.66%
jan 1, 1980
17.831
-1.206
-6.33%
jan 1, 1981
19.407
+1.576
8.84%
jan 1, 1982
19.416
+0.008
0.04%
jan 1, 1983
18.597
-0.819
-4.22%
jan 1, 1984
18.588
-0.009
-0.05%
jan 1, 1985
20.821
+2.233
12.01%
jan 1, 1986
21.727
+0.907
4.35%
jan 1, 1987
22.542
+0.814
3.75%
jan 1, 1988
22.864
+0.322
1.43%
jan 1, 1989
22.565
-0.298
-1.3%
jan 1, 1990
24.65
+2.085
9.24%
jan 1, 1991
22.121
-2.529
-10.26%
jan 1, 1992
21.454
-0.667
-3.01%
jan 1, 1993
22.249
+0.795
3.71%
jan 1, 1994
22.418
+0.169
0.76%
jan 1, 1995
22.201
-0.217
-0.97%
jan 1, 1996
22.046
-0.155
-0.7%
jan 1, 1997
22.538
+0.492
2.23%
jan 1, 1998
23.645
+1.107
4.91%
jan 1, 1999
22.176
-1.469
-6.21%
jan 1, 2000
23.707
+1.531
6.9%
jan 1, 2001
20.77
-2.937
-12.39%
jan 1, 2002
25.635
+4.865
23.42%
jan 1, 2003
32.823
+7.188
28.04%
jan 1, 2004
28.152
-4.671
-14.23%
jan 1, 2005
25.661
-2.491
-8.85%
jan 1, 2006
25.803
+0.142
0.55%
jan 1, 2007
25.714
-0.089
-0.34%
jan 1, 2008
26.395
+0.681
2.65%
jan 1, 2009
27.485
+1.09
4.13%
jan 1, 2010
28.594
+1.109
4.03%
jan 1, 2011
30.563
+1.969
6.89%
jan 1, 2012
29.63
-0.933
-3.05%
jan 1, 2013
29.385
-0.244
-0.82%
jan 1, 2014
30.022
+0.637
2.17%
jan 1, 2015
31.21
+1.188
3.96%
jan 1, 2016
34.913
+3.703
11.87%
Ranking of countries by current statistics by years


Comments: