29
/
en
AIzaSyAYiBZKx7MnpbEhh9jyipgxe19OcubqV5w
April 1, 2024
49830
Middle East & North Africa (IDA & IBRD countries)
TMN
false
2
1
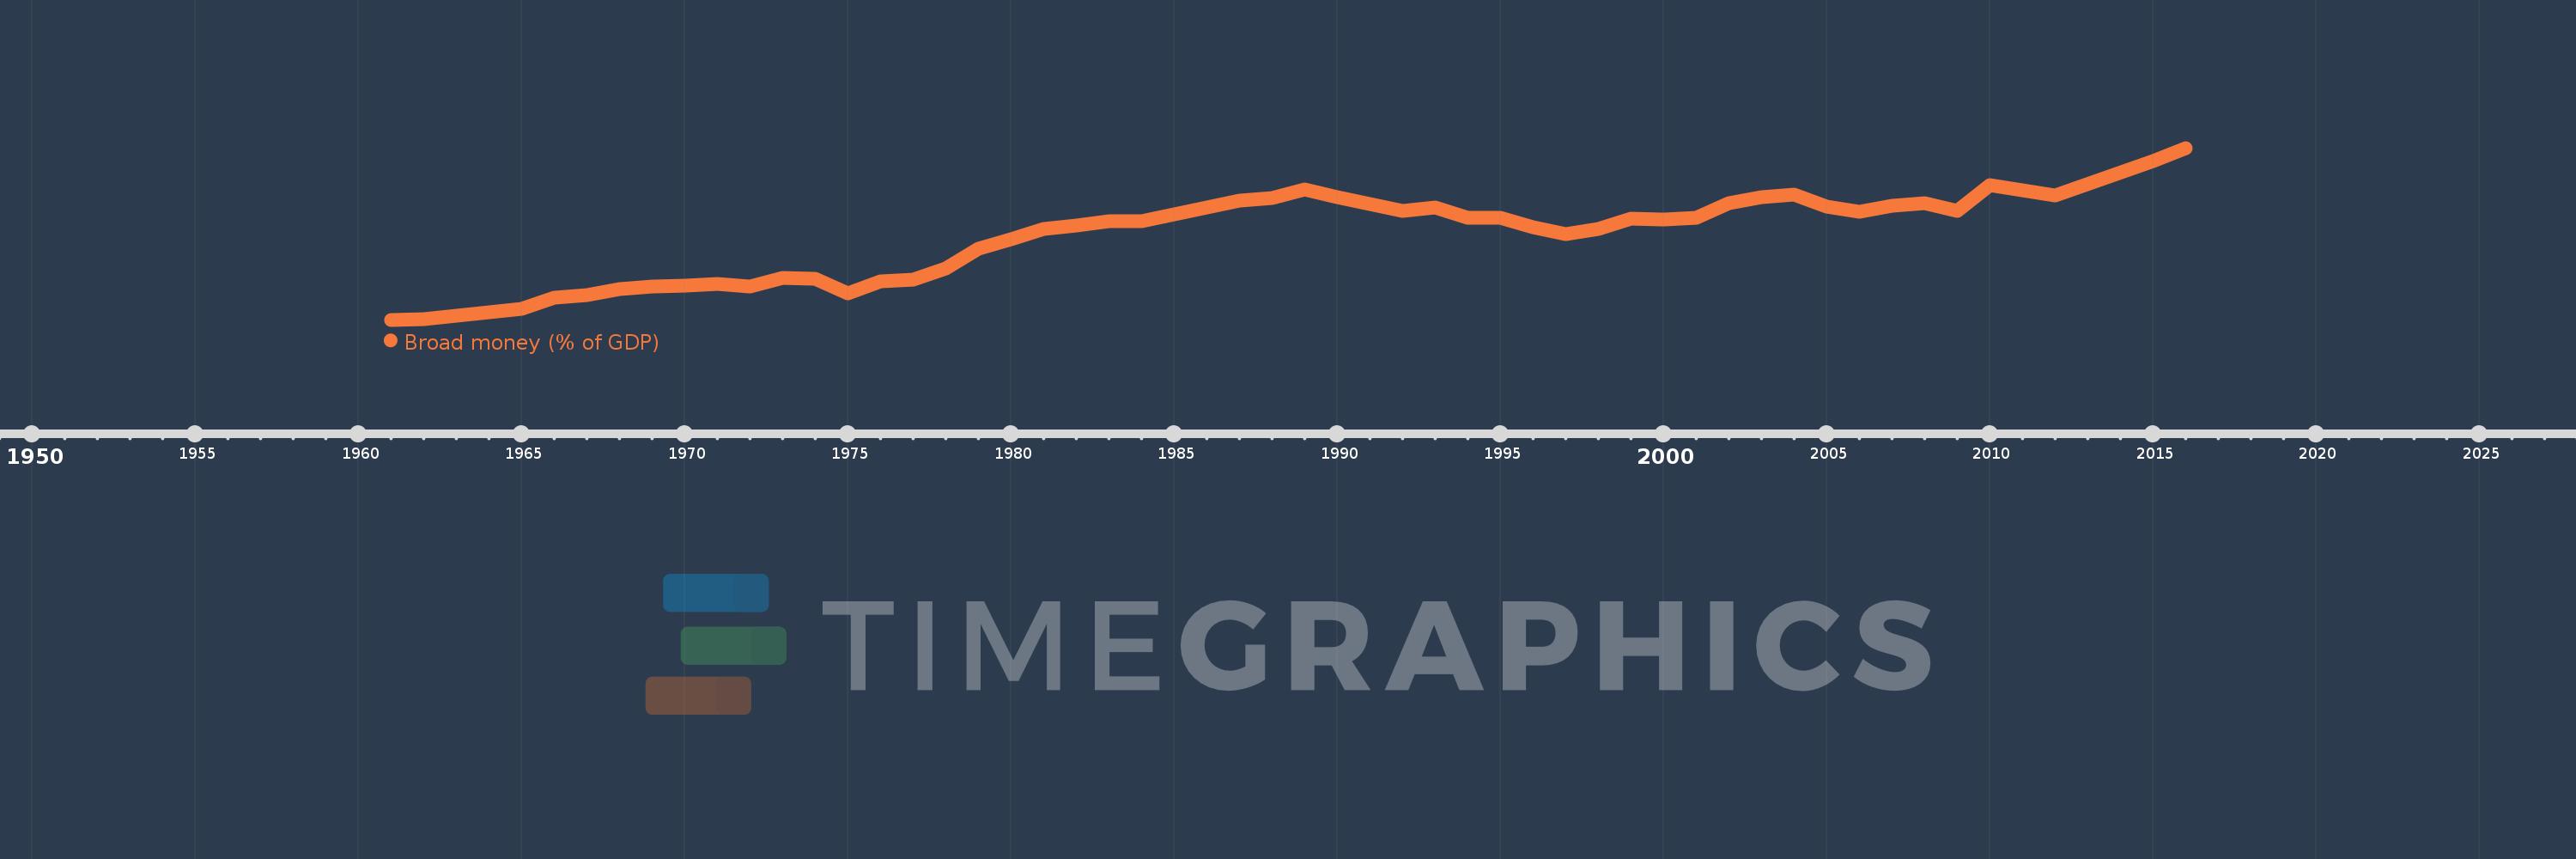
Broad money (% of GDP)
2016,2015,2012,2011,2010,2009,2008,2007,2006,2005,2004,2003,2002,2001,2000,1999,1998,1997,1996,1995,1994,1993,1992,1990,1989,1988,1987,1984,1983,1982,1981,1980,1979,1978,1977,1976,1975,1974,1973,1972,1971,1970,1969,1968,1967,1966,1965,1964,1963,1962,1961
This statistics in other country:
AfghanistanAlbaniaAlgeriaAngolaAntigua and BarbudaArab WorldArgentinaArmeniaArubaAustraliaAzerbaijanBahamas, TheBahrainBangladeshBarbadosBelarusBelizeBeninBhutanBoliviaBosnia and HerzegovinaBotswanaBrazilBrunei DarussalamBulgariaBurkina FasoBurundiCabo VerdeCambodiaCameroonCanadaCaribbean small statesCentral African RepublicCentral Europe and the BalticsChadChileChinaColombiaComorosCongo, Dem. Rep.Congo, Rep.Costa RicaCote d'IvoireCroatiaCzech RepublicDenmarkDjiboutiDominicaDominican RepublicEarly-demographic dividendEast Asia & PacificEast Asia & Pacific (excluding high income)East Asia & Pacific (IDA & IBRD countries)EcuadorEgypt, Arab Rep.El SalvadorEquatorial GuineaEritreaEstoniaEthiopiaEurope & Central Asia (excluding high income)Europe & Central Asia (IDA & IBRD countries)FijiFragile and conflict affected situationsGabonGambia, TheGeorgiaGhanaGrenadaGuatemalaGuineaGuinea-BissauGuyanaHaitiHeavily indebted poor countries (HIPC)High incomeHondurasHong Kong SAR, ChinaHungaryIBRD onlyIcelandIDA & IBRD totalIDA blendIDA onlyIDA totalIndiaIndonesiaIran, Islamic Rep.IraqIsraelJamaicaJapanJordanKazakhstanKenyaKorea, Rep.KuwaitKyrgyz RepublicLao PDRLate-demographic dividendLatin America & Caribbean Latin America & Caribbean (excluding high income)Latin America & the Caribbean (IDA & IBRD countries)LatviaLeast developed countries: UN classificationLebanonLesothoLiberiaLibyaLithuaniaLow & middle incomeLow incomeLower middle incomeMacao SAR, ChinaMacedonia, FYRMadagascarMalawiMalaysiaMaldivesMaliMauritaniaMauritiusMexicoMicronesia, Fed. Sts.Middle East & North AfricaMiddle East & North Africa (excluding high income)Middle East & North Africa (IDA & IBRD countries)Middle incomeMoldovaMongoliaMoroccoMozambiqueMyanmarNamibiaNepalNew ZealandNicaraguaNigerNigeriaNorth AmericaNorwayOECD membersOmanOther small statesPacific island small statesPakistanPanamaPapua New GuineaParaguayPeruPhilippinesPolandPost-demographic dividendPre-demographic dividendQatarRomaniaRussian FederationRwandaSamoaSao Tome and PrincipeSaudi ArabiaSenegalSerbiaSeychellesSierra LeoneSingaporeSlovak RepublicSmall statesSolomon IslandsSouth AfricaSouth AsiaSouth Asia (IDA & IBRD)South SudanSri LankaSt. Kitts and NevisSt. LuciaSt. Vincent and the GrenadinesSub-Saharan Africa Sub-Saharan Africa (excluding high income)Sub-Saharan Africa (IDA & IBRD countries)SudanSurinameSwazilandSwedenSwitzerlandSyrian Arab RepublicTajikistanTanzaniaThailandTimor-LesteTogoTongaTrinidad and TobagoTunisiaTurkeyUgandaUkraineUnited Arab EmiratesUnited KingdomUnited StatesUpper middle incomeUruguayVanuatuVenezuela, RBVietnamWest Bank and GazaWorldYemen, Rep.ZambiaZimbabwe Timeline:
This timeline shows a graph from 1961 to 2016 of Middle East & North Africa (IDA & IBRD countries). No data until 1960. Number of actual observations by date: 51.
Source name:
World Development Indicators
Source organization:
International Monetary Fund, International Financial Statistics and data files, and World Bank and OECD GDP estimates.
Categories, topics:
Financial Sector
Last updated:
apr 23, 2017
Indicators value changes by year
Minimum:
21.427
jan 1, 1961
Maximum:
86.721
jan 1, 2016
At the date of observation
Value
Absolute change
Change from previous value
jan 1, 1961
21.427
+21.427
0.0%
jan 1, 1962
21.636
+0.209
0.97%
jan 1, 1963
23.106
+1.47
6.79%
jan 1, 1964
24.259
+1.153
4.99%
jan 1, 1965
25.695
+1.437
5.92%
jan 1, 1966
29.821
+4.126
16.06%
jan 1, 1967
30.77
+0.949
3.18%
jan 1, 1968
33.165
+2.395
7.78%
jan 1, 1969
33.944
+0.779
2.35%
jan 1, 1970
34.421
+0.477
1.41%
jan 1, 1971
34.921
+0.5
1.45%
jan 1, 1972
34.145
-0.776
-2.22%
jan 1, 1973
37.335
+3.19
9.34%
jan 1, 1974
37.015
-0.32
-0.86%
jan 1, 1975
31.417
-5.599
-15.13%
jan 1, 1976
35.977
+4.561
14.52%
jan 1, 1977
36.586
+0.609
1.69%
jan 1, 1978
40.842
+4.257
11.63%
jan 1, 1979
48.443
+7.6
18.61%
jan 1, 1980
52.029
+3.586
7.4%
jan 1, 1981
55.788
+3.759
7.22%
jan 1, 1982
57.166
+1.379
2.47%
jan 1, 1983
58.911
+1.745
3.05%
jan 1, 1984
58.71
-0.202
-0.34%
jan 1, 1987
66.816
+8.106
13.81%
jan 1, 1988
67.721
+0.905
1.35%
jan 1, 1989
70.825
+3.104
4.58%
jan 1, 1990
67.95
-2.875
-4.06%
jan 1, 1992
62.906
-5.044
-7.42%
jan 1, 1993
64.104
+1.198
1.9%
jan 1, 1994
60.319
-3.785
-5.9%
jan 1, 1995
60.137
-0.183
-0.3%
jan 1, 1996
56.646
-3.491
-5.81%
jan 1, 1997
53.817
-2.829
-4.99%
jan 1, 1998
55.817
+2.0
3.72%
jan 1, 1999
59.871
+4.054
7.26%
jan 1, 2000
59.403
-0.468
-0.78%
jan 1, 2001
60.307
+0.904
1.52%
jan 1, 2002
65.864
+5.557
9.21%
jan 1, 2003
68.061
+2.197
3.34%
jan 1, 2004
69.001
+0.939
1.38%
jan 1, 2005
64.281
-4.719
-6.84%
jan 1, 2006
62.466
-1.816
-2.82%
jan 1, 2007
64.683
+2.217
3.55%
jan 1, 2008
65.694
+1.011
1.56%
jan 1, 2009
62.706
-2.988
-4.55%
jan 1, 2010
72.635
+9.929
15.83%
jan 1, 2011
70.695
-1.941
-2.67%
jan 1, 2012
68.521
-2.174
-3.07%
jan 1, 2015
81.756
+13.235
19.32%
jan 1, 2016
86.721
+4.965
6.07%
Ranking of countries by current statistics by years


Comments: