29
/
en
AIzaSyAYiBZKx7MnpbEhh9jyipgxe19OcubqV5w
April 1, 2024
44865
Low & middle income
LMY
false
2
1
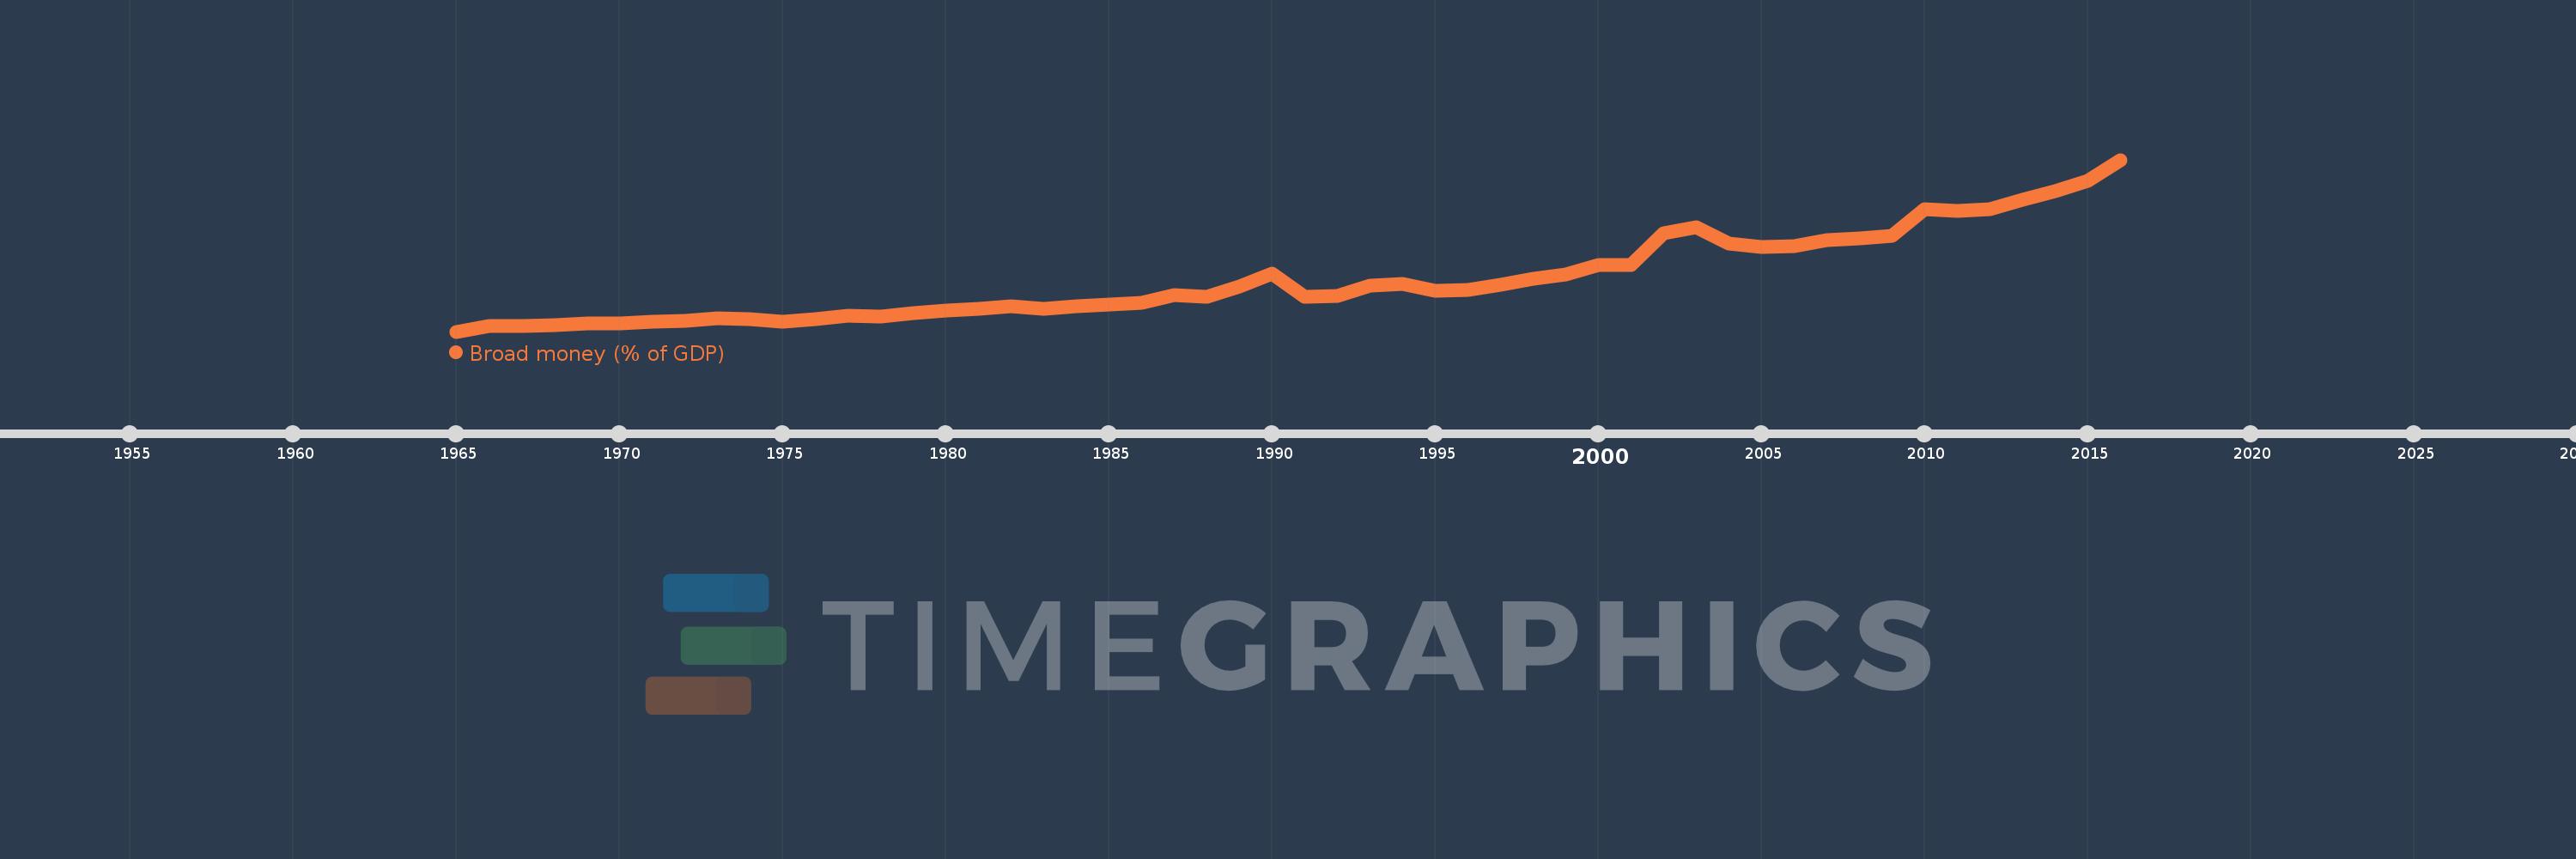
Broad money (% of GDP)
2016,2015,2014,2013,2012,2011,2010,2009,2008,2007,2006,2005,2004,2003,2002,2001,2000,1999,1998,1997,1996,1995,1994,1993,1992,1991,1990,1989,1988,1987,1986,1985,1984,1983,1982,1981,1980,1979,1978,1977,1976,1975,1974,1973,1972,1971,1970,1969,1968,1967,1966,1965
This statistics in other country:
AfghanistanAlbaniaAlgeriaAngolaAntigua and BarbudaArab WorldArgentinaArmeniaArubaAustraliaAzerbaijanBahamas, TheBahrainBangladeshBarbadosBelarusBelizeBeninBhutanBoliviaBosnia and HerzegovinaBotswanaBrazilBrunei DarussalamBulgariaBurkina FasoBurundiCabo VerdeCambodiaCameroonCanadaCaribbean small statesCentral African RepublicCentral Europe and the BalticsChadChileChinaColombiaComorosCongo, Dem. Rep.Congo, Rep.Costa RicaCote d'IvoireCroatiaCzech RepublicDenmarkDjiboutiDominicaDominican RepublicEarly-demographic dividendEast Asia & PacificEast Asia & Pacific (excluding high income)East Asia & Pacific (IDA & IBRD countries)EcuadorEgypt, Arab Rep.El SalvadorEquatorial GuineaEritreaEstoniaEthiopiaEurope & Central Asia (excluding high income)Europe & Central Asia (IDA & IBRD countries)FijiFragile and conflict affected situationsGabonGambia, TheGeorgiaGhanaGrenadaGuatemalaGuineaGuinea-BissauGuyanaHaitiHeavily indebted poor countries (HIPC)High incomeHondurasHong Kong SAR, ChinaHungaryIBRD onlyIcelandIDA & IBRD totalIDA blendIDA onlyIDA totalIndiaIndonesiaIran, Islamic Rep.IraqIsraelJamaicaJapanJordanKazakhstanKenyaKorea, Rep.KuwaitKyrgyz RepublicLao PDRLate-demographic dividendLatin America & Caribbean Latin America & Caribbean (excluding high income)Latin America & the Caribbean (IDA & IBRD countries)LatviaLeast developed countries: UN classificationLebanonLesothoLiberiaLibyaLithuaniaLow & middle incomeLow incomeLower middle incomeMacao SAR, ChinaMacedonia, FYRMadagascarMalawiMalaysiaMaldivesMaliMauritaniaMauritiusMexicoMicronesia, Fed. Sts.Middle East & North AfricaMiddle East & North Africa (excluding high income)Middle East & North Africa (IDA & IBRD countries)Middle incomeMoldovaMongoliaMoroccoMozambiqueMyanmarNamibiaNepalNew ZealandNicaraguaNigerNigeriaNorth AmericaNorwayOECD membersOmanOther small statesPacific island small statesPakistanPanamaPapua New GuineaParaguayPeruPhilippinesPolandPost-demographic dividendPre-demographic dividendQatarRomaniaRussian FederationRwandaSamoaSao Tome and PrincipeSaudi ArabiaSenegalSerbiaSeychellesSierra LeoneSingaporeSlovak RepublicSmall statesSolomon IslandsSouth AfricaSouth AsiaSouth Asia (IDA & IBRD)South SudanSri LankaSt. Kitts and NevisSt. LuciaSt. Vincent and the GrenadinesSub-Saharan Africa Sub-Saharan Africa (excluding high income)Sub-Saharan Africa (IDA & IBRD countries)SudanSurinameSwazilandSwedenSwitzerlandSyrian Arab RepublicTajikistanTanzaniaThailandTimor-LesteTogoTongaTrinidad and TobagoTunisiaTurkeyUgandaUkraineUnited Arab EmiratesUnited KingdomUnited StatesUpper middle incomeUruguayVanuatuVenezuela, RBVietnamWest Bank and GazaWorldYemen, Rep.ZambiaZimbabwe Timeline:
This timeline shows a graph from 1965 to 2016 of Low & middle income. No data until 1964. Number of actual observations by date: 52.
Source name:
World Development Indicators
Source organization:
International Monetary Fund, International Financial Statistics and data files, and World Bank and OECD GDP estimates.
Categories, topics:
Financial Sector
Last updated:
apr 23, 2017
Indicators value changes by year
Maximum:
125.787
jan 1, 2016
At the date of observation
Value
Absolute change
Change from previous value
jan 1, 1965
20.97
+20.97
0.0%
jan 1, 1966
24.126
+3.156
15.05%
jan 1, 1967
24.466
+0.34
1.41%
jan 1, 1968
24.812
+0.347
1.42%
jan 1, 1969
25.917
+1.105
4.45%
jan 1, 1970
26.146
+0.229
0.88%
jan 1, 1971
26.736
+0.59
2.26%
jan 1, 1972
27.425
+0.688
2.57%
jan 1, 1973
28.927
+1.502
5.48%
jan 1, 1974
28.814
-0.113
-0.39%
jan 1, 1975
27.057
-1.757
-6.1%
jan 1, 1976
28.521
+1.464
5.41%
jan 1, 1977
30.456
+1.935
6.79%
jan 1, 1978
30.227
-0.229
-0.75%
jan 1, 1979
32.003
+1.776
5.87%
jan 1, 1980
33.814
+1.811
5.66%
jan 1, 1981
35.009
+1.195
3.53%
jan 1, 1982
36.259
+1.25
3.57%
jan 1, 1983
35.031
-1.228
-3.39%
jan 1, 1984
36.381
+1.35
3.85%
jan 1, 1985
37.337
+0.956
2.63%
jan 1, 1986
38.274
+0.937
2.51%
jan 1, 1987
43.122
+4.849
12.67%
jan 1, 1988
42.281
-0.841
-1.95%
jan 1, 1989
48.372
+6.09
14.4%
jan 1, 1990
56.604
+8.232
17.02%
jan 1, 1991
42.323
-14.281
-25.23%
jan 1, 1992
42.915
+0.592
1.4%
jan 1, 1993
48.832
+5.918
13.79%
jan 1, 1994
49.894
+1.061
2.17%
jan 1, 1995
46.122
-3.772
-7.56%
jan 1, 1996
46.381
+0.259
0.56%
jan 1, 1997
49.393
+3.012
6.5%
jan 1, 1998
52.947
+3.554
7.19%
jan 1, 1999
56.039
+3.091
5.84%
jan 1, 2000
61.724
+5.686
10.15%
jan 1, 2001
61.341
-0.383
-0.62%
jan 1, 2002
80.748
+19.407
31.64%
jan 1, 2003
84.689
+3.94
4.88%
jan 1, 2004
74.595
-10.094
-11.92%
jan 1, 2005
72.584
-2.011
-2.7%
jan 1, 2006
73.092
+0.509
0.7%
jan 1, 2007
76.697
+3.604
4.93%
jan 1, 2008
77.965
+1.269
1.65%
jan 1, 2009
79.401
+1.436
1.84%
jan 1, 2010
95.545
+16.145
20.33%
jan 1, 2011
94.401
-1.145
-1.2%
jan 1, 2012
95.589
+1.189
1.26%
jan 1, 2013
101.538
+5.948
6.22%
jan 1, 2014
106.799
+5.261
5.18%
jan 1, 2015
113.205
+6.406
6.0%
jan 1, 2016
125.787
+12.583
11.11%
Ranking of countries by current statistics by years


Comments: