29
/
en
AIzaSyAYiBZKx7MnpbEhh9jyipgxe19OcubqV5w
April 1, 2024
31355
Europe & Central Asia (excluding high income)
ECA
false
2
1
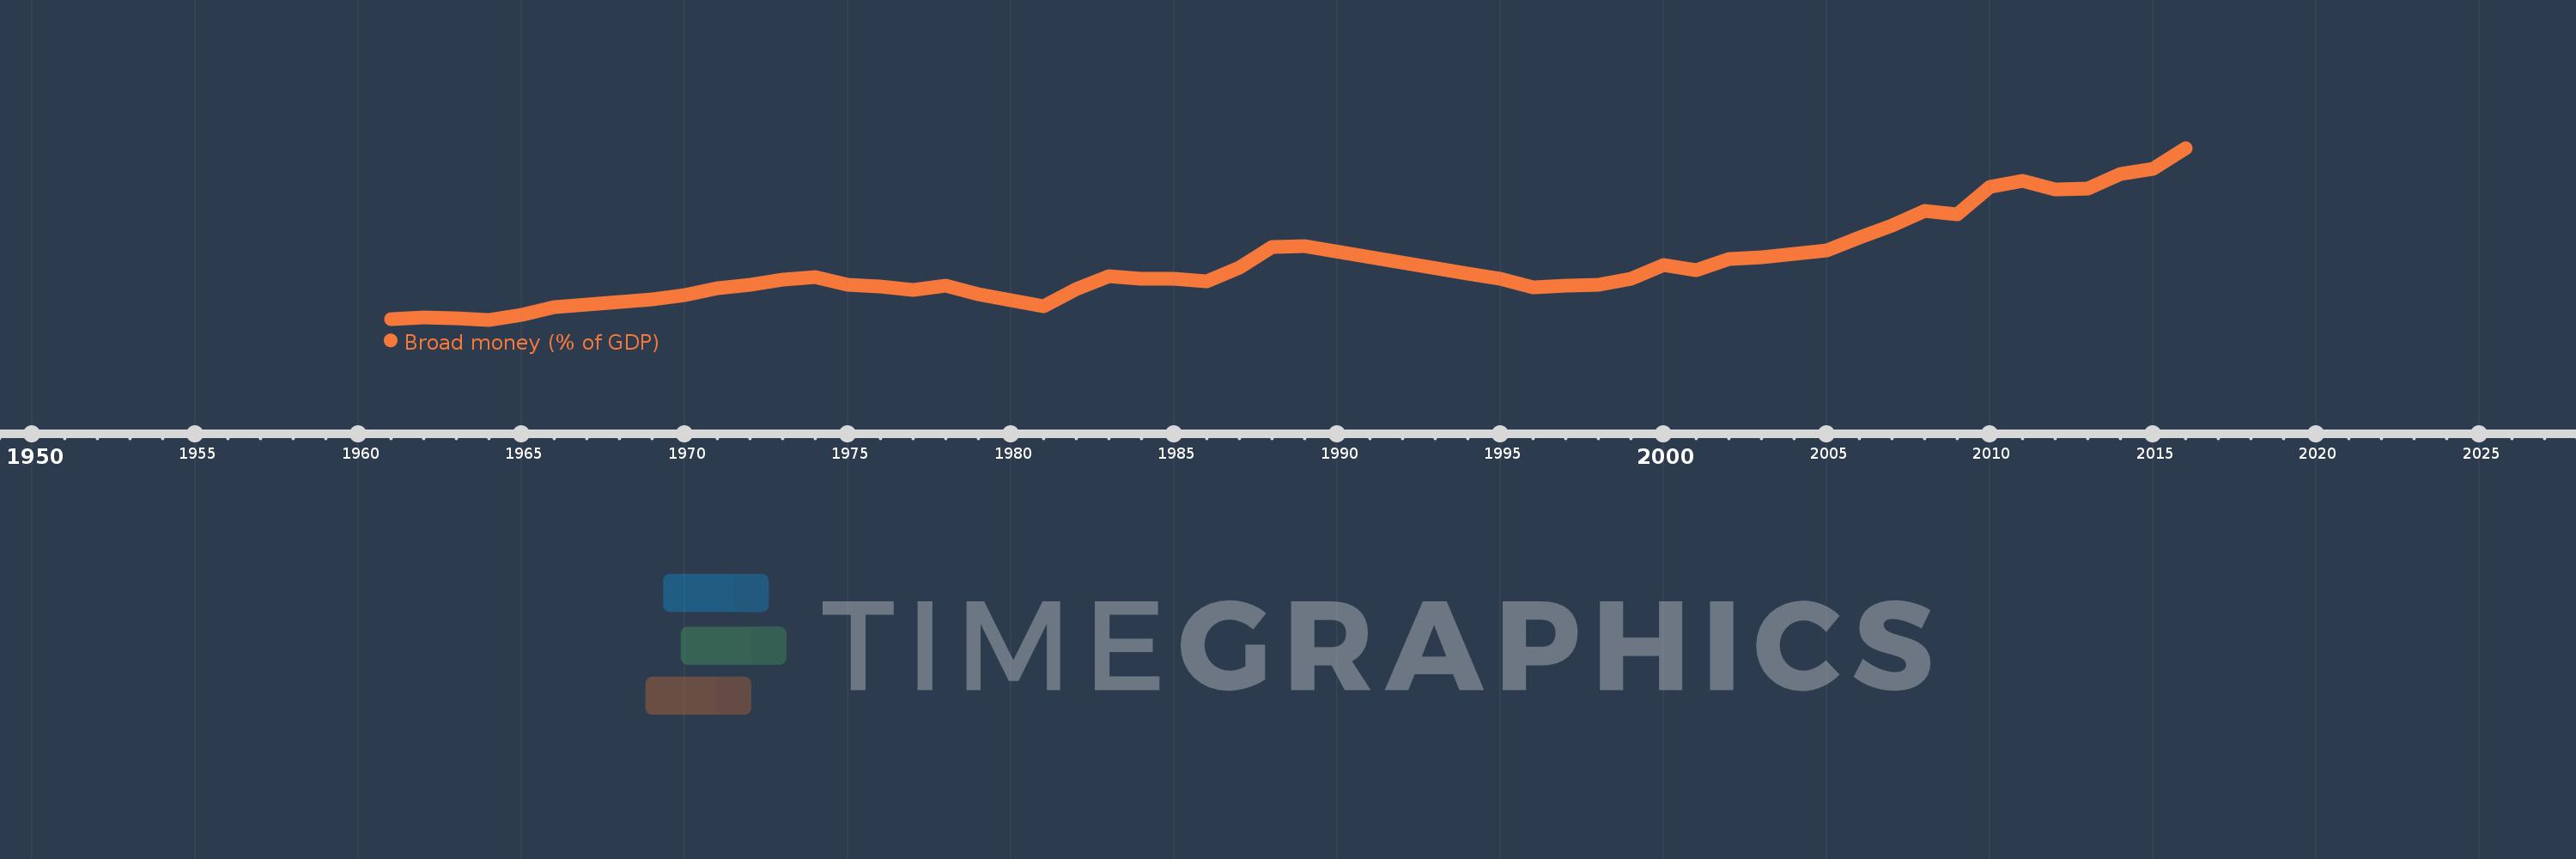
Broad money (% of GDP)
2016,2015,2014,2013,2012,2011,2010,2009,2008,2007,2006,2005,2004,2003,2002,2001,2000,1999,1998,1997,1996,1995,1994,1989,1988,1987,1986,1985,1984,1983,1982,1981,1980,1979,1978,1977,1976,1975,1974,1973,1972,1971,1970,1969,1968,1967,1966,1965,1964,1963,1962,1961
This statistics in other country:
AfghanistanAlbaniaAlgeriaAngolaAntigua and BarbudaArab WorldArgentinaArmeniaArubaAustraliaAzerbaijanBahamas, TheBahrainBangladeshBarbadosBelarusBelizeBeninBhutanBoliviaBosnia and HerzegovinaBotswanaBrazilBrunei DarussalamBulgariaBurkina FasoBurundiCabo VerdeCambodiaCameroonCanadaCaribbean small statesCentral African RepublicCentral Europe and the BalticsChadChileChinaColombiaComorosCongo, Dem. Rep.Congo, Rep.Costa RicaCote d'IvoireCroatiaCzech RepublicDenmarkDjiboutiDominicaDominican RepublicEarly-demographic dividendEast Asia & PacificEast Asia & Pacific (excluding high income)East Asia & Pacific (IDA & IBRD countries)EcuadorEgypt, Arab Rep.El SalvadorEquatorial GuineaEritreaEstoniaEthiopiaEurope & Central Asia (excluding high income)Europe & Central Asia (IDA & IBRD countries)FijiFragile and conflict affected situationsGabonGambia, TheGeorgiaGhanaGrenadaGuatemalaGuineaGuinea-BissauGuyanaHaitiHeavily indebted poor countries (HIPC)High incomeHondurasHong Kong SAR, ChinaHungaryIBRD onlyIcelandIDA & IBRD totalIDA blendIDA onlyIDA totalIndiaIndonesiaIran, Islamic Rep.IraqIsraelJamaicaJapanJordanKazakhstanKenyaKorea, Rep.KuwaitKyrgyz RepublicLao PDRLate-demographic dividendLatin America & Caribbean Latin America & Caribbean (excluding high income)Latin America & the Caribbean (IDA & IBRD countries)LatviaLeast developed countries: UN classificationLebanonLesothoLiberiaLibyaLithuaniaLow & middle incomeLow incomeLower middle incomeMacao SAR, ChinaMacedonia, FYRMadagascarMalawiMalaysiaMaldivesMaliMauritaniaMauritiusMexicoMicronesia, Fed. Sts.Middle East & North AfricaMiddle East & North Africa (excluding high income)Middle East & North Africa (IDA & IBRD countries)Middle incomeMoldovaMongoliaMoroccoMozambiqueMyanmarNamibiaNepalNew ZealandNicaraguaNigerNigeriaNorth AmericaNorwayOECD membersOmanOther small statesPacific island small statesPakistanPanamaPapua New GuineaParaguayPeruPhilippinesPolandPost-demographic dividendPre-demographic dividendQatarRomaniaRussian FederationRwandaSamoaSao Tome and PrincipeSaudi ArabiaSenegalSerbiaSeychellesSierra LeoneSingaporeSlovak RepublicSmall statesSolomon IslandsSouth AfricaSouth AsiaSouth Asia (IDA & IBRD)South SudanSri LankaSt. Kitts and NevisSt. LuciaSt. Vincent and the GrenadinesSub-Saharan Africa Sub-Saharan Africa (excluding high income)Sub-Saharan Africa (IDA & IBRD countries)SudanSurinameSwazilandSwedenSwitzerlandSyrian Arab RepublicTajikistanTanzaniaThailandTimor-LesteTogoTongaTrinidad and TobagoTunisiaTurkeyUgandaUkraineUnited Arab EmiratesUnited KingdomUnited StatesUpper middle incomeUruguayVanuatuVenezuela, RBVietnamWest Bank and GazaWorldYemen, Rep.ZambiaZimbabwe Timeline:
This timeline shows a graph from 1961 to 2016 of Europe & Central Asia (excluding high income). No data until 1960. Number of actual observations by date: 52.
Source name:
World Development Indicators
Source organization:
International Monetary Fund, International Financial Statistics and data files, and World Bank and OECD GDP estimates.
Categories, topics:
Financial Sector
Last updated:
apr 23, 2017
Indicators value changes by year
Minimum:
14.592
jan 1, 1964
Maximum:
58.385
jan 1, 2016
At the date of observation
Value
Absolute change
Change from previous value
jan 1, 1961
14.699
+14.699
0.0%
jan 1, 1962
15.208
+0.509
3.46%
jan 1, 1963
14.944
-0.264
-1.73%
jan 1, 1964
14.592
-0.352
-2.35%
jan 1, 1965
15.934
+1.342
9.2%
jan 1, 1966
17.721
+1.787
11.21%
jan 1, 1967
18.442
+0.721
4.07%
jan 1, 1968
19.227
+0.785
4.26%
jan 1, 1969
19.829
+0.602
3.13%
jan 1, 1970
20.862
+1.033
5.21%
jan 1, 1971
22.673
+1.811
8.68%
jan 1, 1972
23.541
+0.867
3.83%
jan 1, 1973
24.886
+1.345
5.71%
jan 1, 1974
25.382
+0.497
2.0%
jan 1, 1975
23.418
-1.965
-7.74%
jan 1, 1976
23.057
-0.361
-1.54%
jan 1, 1977
22.285
-0.772
-3.35%
jan 1, 1978
23.237
+0.952
4.27%
jan 1, 1979
21.185
-2.052
-8.83%
jan 1, 1980
19.509
-1.676
-7.91%
jan 1, 1981
18.034
-1.475
-7.56%
jan 1, 1982
22.488
+4.454
24.7%
jan 1, 1983
25.596
+3.107
13.82%
jan 1, 1984
25.051
-0.545
-2.13%
jan 1, 1985
25.133
+0.082
0.33%
jan 1, 1986
24.446
-0.687
-2.73%
jan 1, 1987
27.896
+3.451
14.12%
jan 1, 1988
33.08
+5.184
18.58%
jan 1, 1989
33.343
+0.263
0.79%
jan 1, 1994
26.458
-6.885
-20.65%
jan 1, 1995
25.091
-1.367
-5.17%
jan 1, 1996
22.909
-2.183
-8.7%
jan 1, 1997
23.359
+0.45
1.97%
jan 1, 1998
23.583
+0.224
0.96%
jan 1, 1999
25.05
+1.467
6.22%
jan 1, 2000
28.61
+3.56
14.21%
jan 1, 2001
27.126
-1.484
-5.19%
jan 1, 2002
30.032
+2.906
10.71%
jan 1, 2003
30.597
+0.565
1.88%
jan 1, 2004
31.353
+0.756
2.47%
jan 1, 2005
32.218
+0.865
2.76%
jan 1, 2006
35.534
+3.317
10.29%
jan 1, 2007
38.542
+3.007
8.46%
jan 1, 2008
42.387
+3.846
9.98%
jan 1, 2009
41.362
-1.025
-2.42%
jan 1, 2010
48.432
+7.07
17.09%
jan 1, 2011
50.063
+1.63
3.37%
jan 1, 2012
47.71
-2.352
-4.7%
jan 1, 2013
48.0
+0.289
0.61%
jan 1, 2014
51.734
+3.734
7.78%
jan 1, 2015
53.089
+1.355
2.62%
jan 1, 2016
58.385
+5.297
9.98%
Ranking of countries by current statistics by years


Comments: