29
/
en
AIzaSyAYiBZKx7MnpbEhh9jyipgxe19OcubqV5w
April 1, 2024
37973
IDA blend
IDB
false
2
1
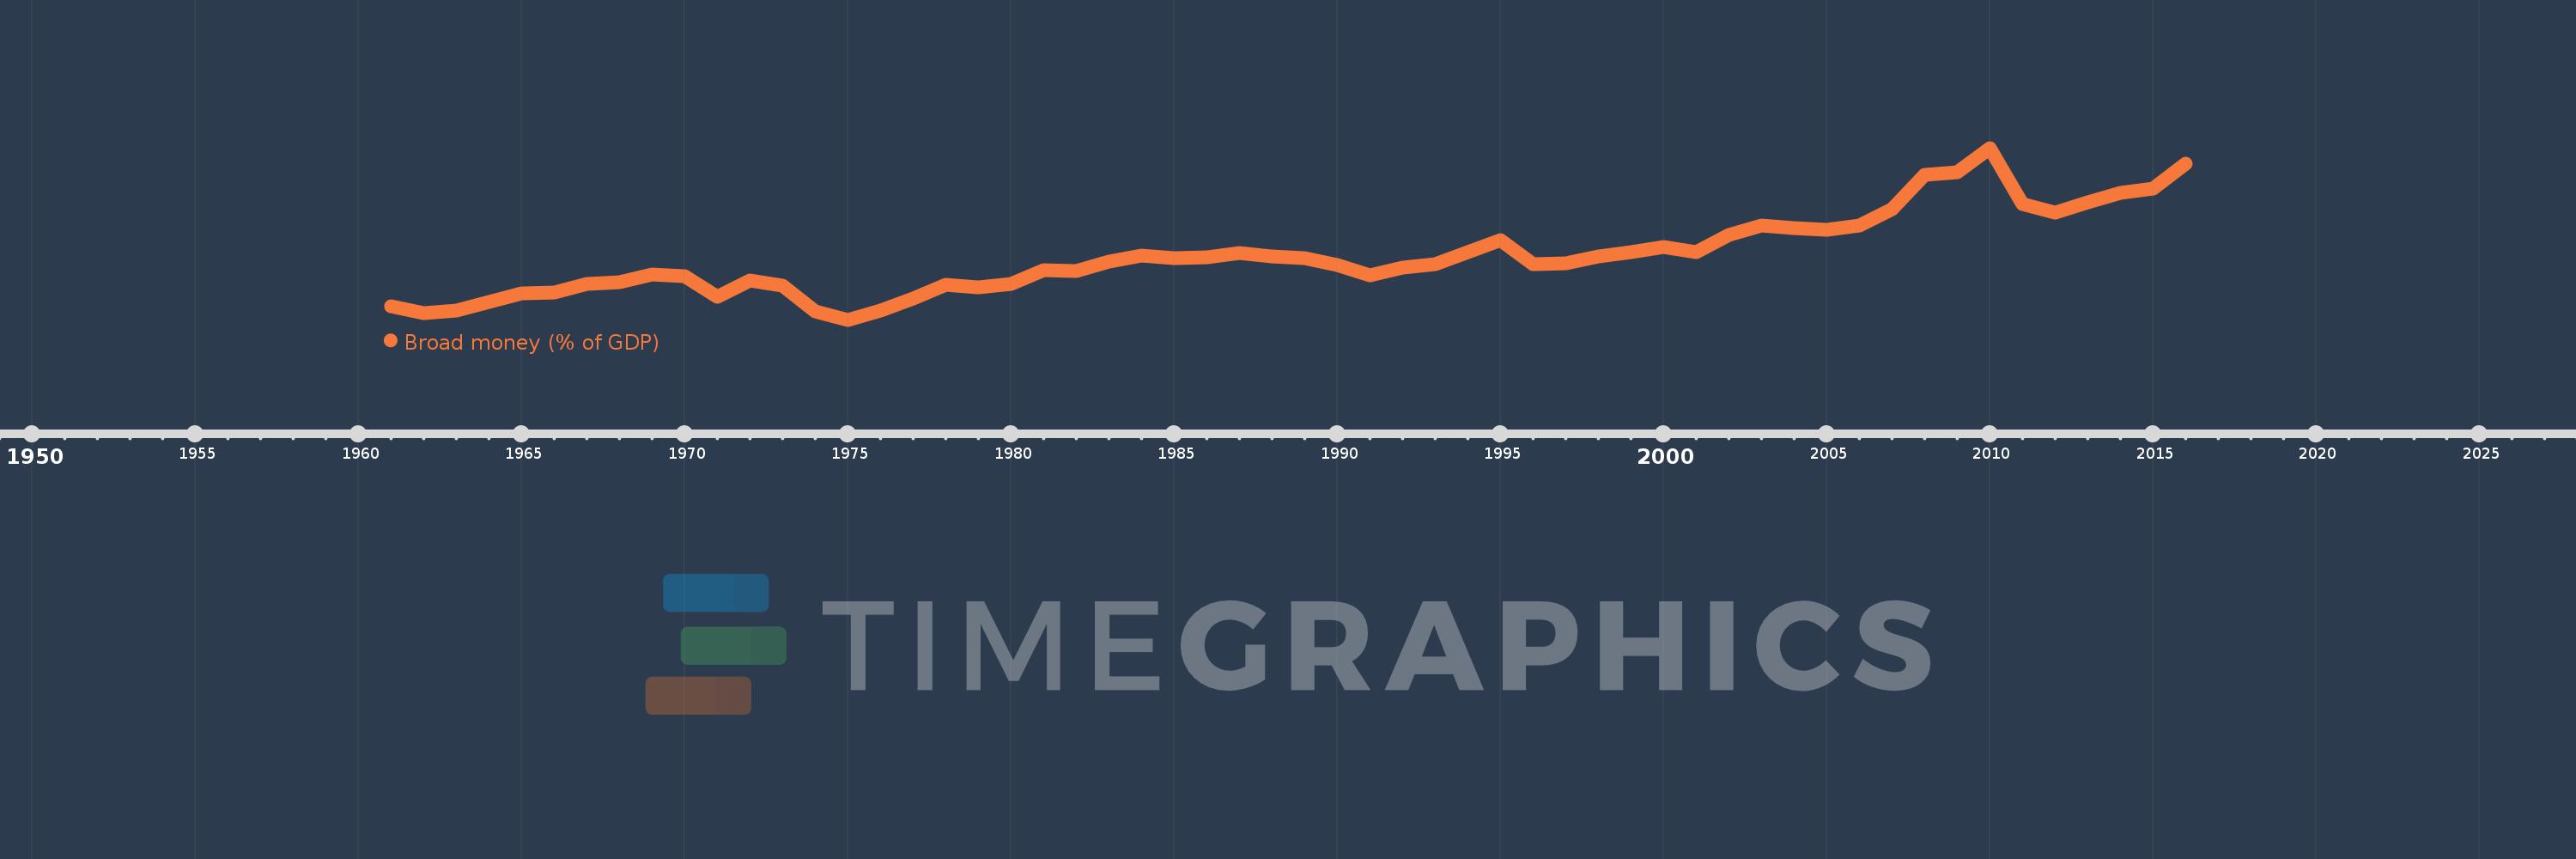
Broad money (% of GDP)
2016,2015,2014,2013,2012,2011,2010,2009,2008,2007,2006,2005,2004,2003,2002,2001,2000,1999,1998,1997,1996,1995,1994,1993,1992,1991,1990,1989,1988,1987,1986,1985,1984,1983,1982,1981,1980,1979,1978,1977,1976,1975,1974,1973,1972,1971,1970,1969,1968,1967,1966,1965,1964,1963,1962,1961
This statistics in other country:
AfghanistanAlbaniaAlgeriaAngolaAntigua and BarbudaArab WorldArgentinaArmeniaArubaAustraliaAzerbaijanBahamas, TheBahrainBangladeshBarbadosBelarusBelizeBeninBhutanBoliviaBosnia and HerzegovinaBotswanaBrazilBrunei DarussalamBulgariaBurkina FasoBurundiCabo VerdeCambodiaCameroonCanadaCaribbean small statesCentral African RepublicCentral Europe and the BalticsChadChileChinaColombiaComorosCongo, Dem. Rep.Congo, Rep.Costa RicaCote d'IvoireCroatiaCzech RepublicDenmarkDjiboutiDominicaDominican RepublicEarly-demographic dividendEast Asia & PacificEast Asia & Pacific (excluding high income)East Asia & Pacific (IDA & IBRD countries)EcuadorEgypt, Arab Rep.El SalvadorEquatorial GuineaEritreaEstoniaEthiopiaEurope & Central Asia (excluding high income)Europe & Central Asia (IDA & IBRD countries)FijiFragile and conflict affected situationsGabonGambia, TheGeorgiaGhanaGrenadaGuatemalaGuineaGuinea-BissauGuyanaHaitiHeavily indebted poor countries (HIPC)High incomeHondurasHong Kong SAR, ChinaHungaryIBRD onlyIcelandIDA & IBRD totalIDA blendIDA onlyIDA totalIndiaIndonesiaIran, Islamic Rep.IraqIsraelJamaicaJapanJordanKazakhstanKenyaKorea, Rep.KuwaitKyrgyz RepublicLao PDRLate-demographic dividendLatin America & Caribbean Latin America & Caribbean (excluding high income)Latin America & the Caribbean (IDA & IBRD countries)LatviaLeast developed countries: UN classificationLebanonLesothoLiberiaLibyaLithuaniaLow & middle incomeLow incomeLower middle incomeMacao SAR, ChinaMacedonia, FYRMadagascarMalawiMalaysiaMaldivesMaliMauritaniaMauritiusMexicoMicronesia, Fed. Sts.Middle East & North AfricaMiddle East & North Africa (excluding high income)Middle East & North Africa (IDA & IBRD countries)Middle incomeMoldovaMongoliaMoroccoMozambiqueMyanmarNamibiaNepalNew ZealandNicaraguaNigerNigeriaNorth AmericaNorwayOECD membersOmanOther small statesPacific island small statesPakistanPanamaPapua New GuineaParaguayPeruPhilippinesPolandPost-demographic dividendPre-demographic dividendQatarRomaniaRussian FederationRwandaSamoaSao Tome and PrincipeSaudi ArabiaSenegalSerbiaSeychellesSierra LeoneSingaporeSlovak RepublicSmall statesSolomon IslandsSouth AfricaSouth AsiaSouth Asia (IDA & IBRD)South SudanSri LankaSt. Kitts and NevisSt. LuciaSt. Vincent and the GrenadinesSub-Saharan Africa Sub-Saharan Africa (excluding high income)Sub-Saharan Africa (IDA & IBRD countries)SudanSurinameSwazilandSwedenSwitzerlandSyrian Arab RepublicTajikistanTanzaniaThailandTimor-LesteTogoTongaTrinidad and TobagoTunisiaTurkeyUgandaUkraineUnited Arab EmiratesUnited KingdomUnited StatesUpper middle incomeUruguayVanuatuVenezuela, RBVietnamWest Bank and GazaWorldYemen, Rep.ZambiaZimbabwe Timeline:
This timeline shows a graph from 1961 to 2016 of IDA blend. No data until 1960. Number of actual observations by date: 56.
Source name:
World Development Indicators
Source organization:
International Monetary Fund, International Financial Statistics and data files, and World Bank and OECD GDP estimates.
Categories, topics:
Financial Sector
Last updated:
apr 23, 2017
Indicators value changes by year
Minimum:
19.227
jan 1, 1975
Maximum:
57.207
jan 1, 2010
At the date of observation
Value
Absolute change
Change from previous value
jan 1, 1961
22.255
+22.255
0.0%
jan 1, 1962
20.75
-1.505
-6.76%
jan 1, 1963
21.266
+0.516
2.49%
jan 1, 1964
23.207
+1.941
9.13%
jan 1, 1965
24.985
+1.779
7.67%
jan 1, 1966
25.251
+0.265
1.06%
jan 1, 1967
27.15
+1.9
7.52%
jan 1, 1968
27.468
+0.317
1.17%
jan 1, 1969
29.298
+1.83
6.66%
jan 1, 1970
28.906
-0.392
-1.34%
jan 1, 1971
24.292
-4.614
-15.96%
jan 1, 1972
27.819
+3.527
14.52%
jan 1, 1973
26.743
-1.076
-3.87%
jan 1, 1974
21.107
-5.636
-21.08%
jan 1, 1975
19.227
-1.88
-8.91%
jan 1, 1976
21.272
+2.045
10.64%
jan 1, 1977
23.881
+2.609
12.26%
jan 1, 1978
26.91
+3.029
12.69%
jan 1, 1979
26.387
-0.523
-1.94%
jan 1, 1980
27.125
+0.738
2.8%
jan 1, 1981
30.127
+3.001
11.06%
jan 1, 1982
29.998
-0.128
-0.43%
jan 1, 1983
32.064
+2.066
6.89%
jan 1, 1984
33.442
+1.378
4.3%
jan 1, 1985
32.788
-0.654
-1.95%
jan 1, 1986
32.971
+0.182
0.56%
jan 1, 1987
33.908
+0.937
2.84%
jan 1, 1988
33.249
-0.659
-1.94%
jan 1, 1989
32.906
-0.344
-1.03%
jan 1, 1990
31.366
-1.54
-4.68%
jan 1, 1991
29.118
-2.248
-7.17%
jan 1, 1992
30.846
+1.728
5.93%
jan 1, 1993
31.439
+0.593
1.92%
jan 1, 1994
34.165
+2.725
8.67%
jan 1, 1995
36.912
+2.748
8.04%
jan 1, 1996
31.585
-5.327
-14.43%
jan 1, 1997
31.624
+0.039
0.12%
jan 1, 1998
33.305
+1.682
5.32%
jan 1, 1999
34.142
+0.837
2.51%
jan 1, 2000
35.303
+1.161
3.4%
jan 1, 2001
34.125
-1.178
-3.34%
jan 1, 2002
37.915
+3.79
11.11%
jan 1, 2003
40.104
+2.189
5.77%
jan 1, 2004
39.446
-0.658
-1.64%
jan 1, 2005
39.056
-0.389
-0.99%
jan 1, 2006
39.983
+0.927
2.37%
jan 1, 2007
43.581
+3.598
9.0%
jan 1, 2008
51.202
+7.621
17.49%
jan 1, 2009
51.786
+0.584
1.14%
jan 1, 2010
57.207
+5.421
10.47%
jan 1, 2011
44.767
-12.44
-21.75%
jan 1, 2012
42.891
-1.876
-4.19%
jan 1, 2013
45.238
+2.346
5.47%
jan 1, 2014
47.218
+1.98
4.38%
jan 1, 2015
48.233
+1.015
2.15%
jan 1, 2016
53.682
+5.45
11.3%
Ranking of countries by current statistics by years


Comments: