29
/
en
AIzaSyAYiBZKx7MnpbEhh9jyipgxe19OcubqV5w
April 1, 2024
47949
Middle East & North Africa
MEA
false
2
1
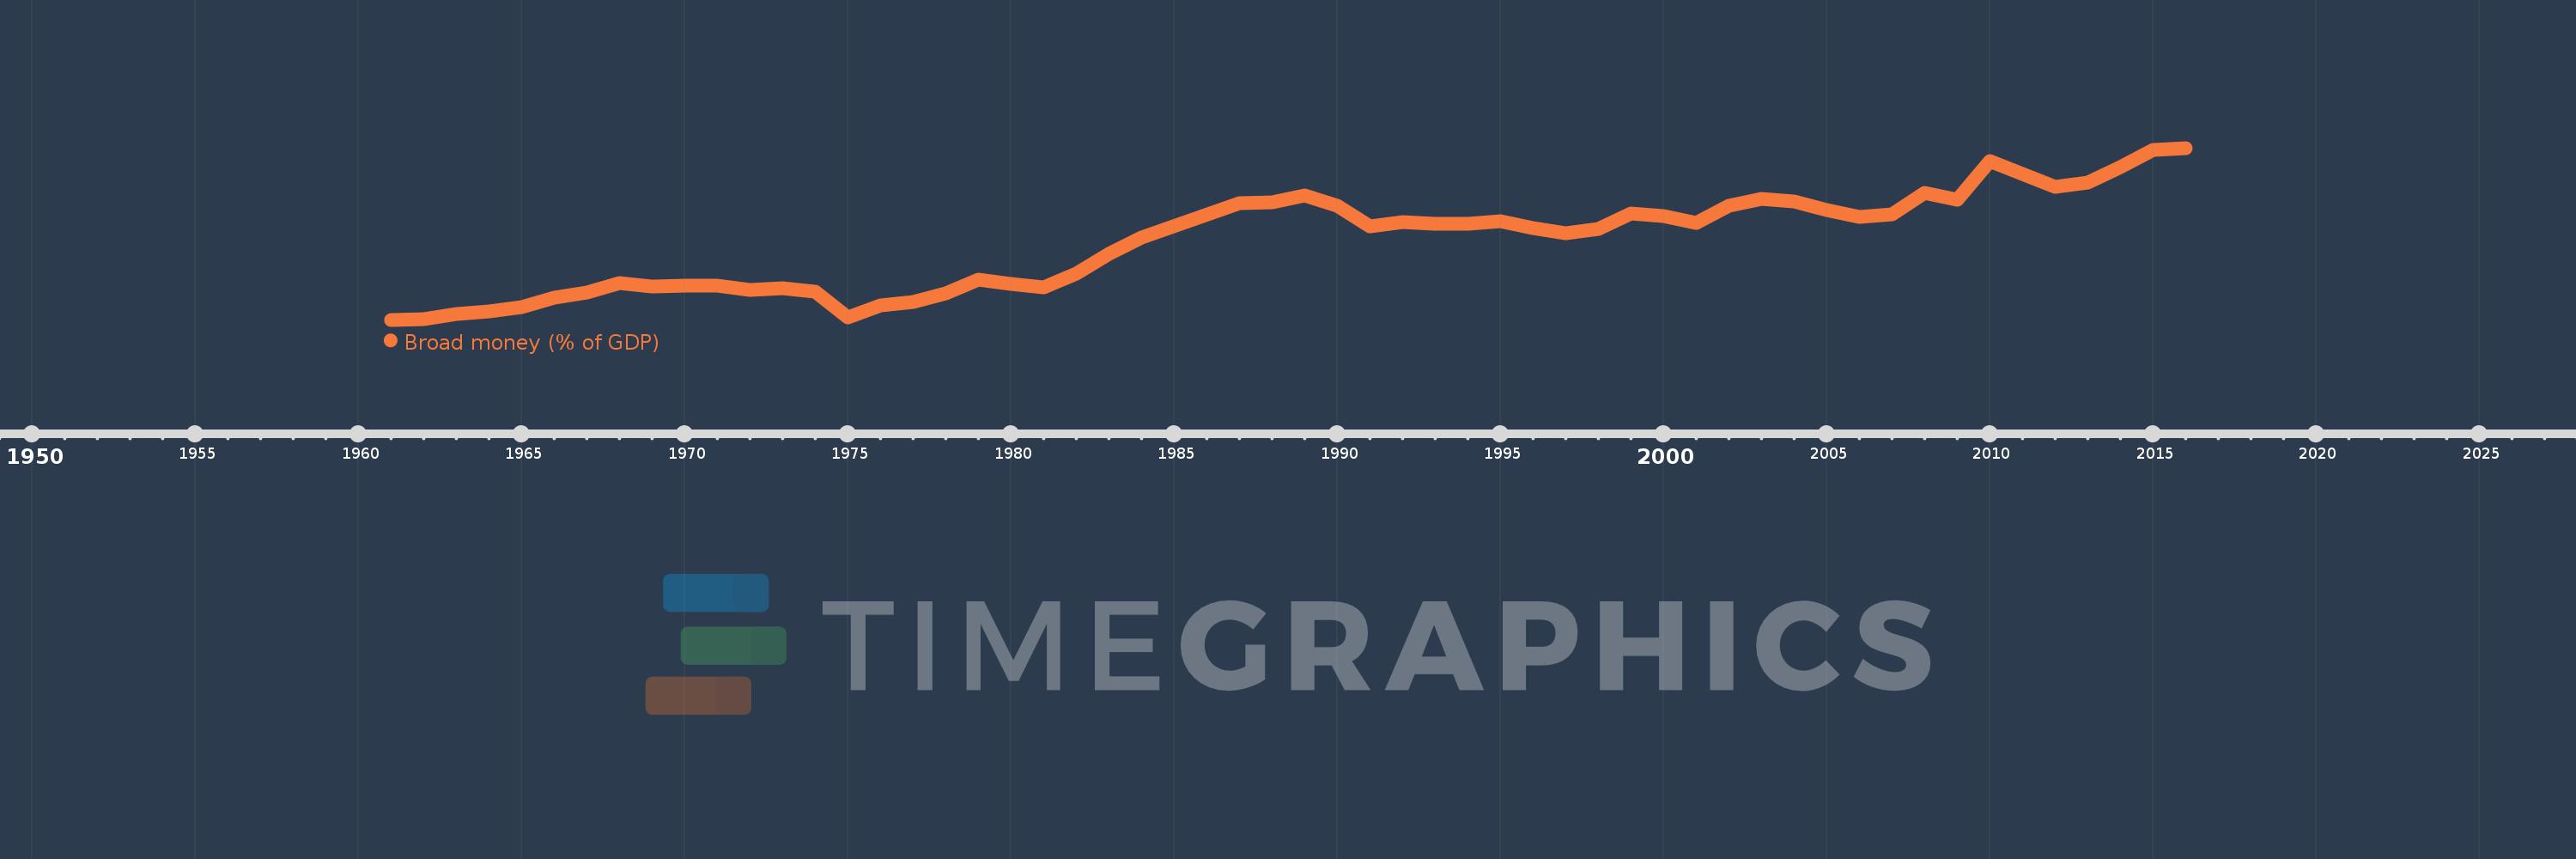
Broad money (% of GDP)
2016,2015,2014,2013,2012,2011,2010,2009,2008,2007,2006,2005,2004,2003,2002,2001,2000,1999,1998,1997,1996,1995,1994,1993,1992,1991,1990,1989,1988,1987,1984,1983,1982,1981,1980,1979,1978,1977,1976,1975,1974,1973,1972,1971,1970,1969,1968,1967,1966,1965,1964,1963,1962,1961
This statistics in other country:
AfghanistanAlbaniaAlgeriaAngolaAntigua and BarbudaArab WorldArgentinaArmeniaArubaAustraliaAzerbaijanBahamas, TheBahrainBangladeshBarbadosBelarusBelizeBeninBhutanBoliviaBosnia and HerzegovinaBotswanaBrazilBrunei DarussalamBulgariaBurkina FasoBurundiCabo VerdeCambodiaCameroonCanadaCaribbean small statesCentral African RepublicCentral Europe and the BalticsChadChileChinaColombiaComorosCongo, Dem. Rep.Congo, Rep.Costa RicaCote d'IvoireCroatiaCzech RepublicDenmarkDjiboutiDominicaDominican RepublicEarly-demographic dividendEast Asia & PacificEast Asia & Pacific (excluding high income)East Asia & Pacific (IDA & IBRD countries)EcuadorEgypt, Arab Rep.El SalvadorEquatorial GuineaEritreaEstoniaEthiopiaEurope & Central Asia (excluding high income)Europe & Central Asia (IDA & IBRD countries)FijiFragile and conflict affected situationsGabonGambia, TheGeorgiaGhanaGrenadaGuatemalaGuineaGuinea-BissauGuyanaHaitiHeavily indebted poor countries (HIPC)High incomeHondurasHong Kong SAR, ChinaHungaryIBRD onlyIcelandIDA & IBRD totalIDA blendIDA onlyIDA totalIndiaIndonesiaIran, Islamic Rep.IraqIsraelJamaicaJapanJordanKazakhstanKenyaKorea, Rep.KuwaitKyrgyz RepublicLao PDRLate-demographic dividendLatin America & Caribbean Latin America & Caribbean (excluding high income)Latin America & the Caribbean (IDA & IBRD countries)LatviaLeast developed countries: UN classificationLebanonLesothoLiberiaLibyaLithuaniaLow & middle incomeLow incomeLower middle incomeMacao SAR, ChinaMacedonia, FYRMadagascarMalawiMalaysiaMaldivesMaliMauritaniaMauritiusMexicoMicronesia, Fed. Sts.Middle East & North AfricaMiddle East & North Africa (excluding high income)Middle East & North Africa (IDA & IBRD countries)Middle incomeMoldovaMongoliaMoroccoMozambiqueMyanmarNamibiaNepalNew ZealandNicaraguaNigerNigeriaNorth AmericaNorwayOECD membersOmanOther small statesPacific island small statesPakistanPanamaPapua New GuineaParaguayPeruPhilippinesPolandPost-demographic dividendPre-demographic dividendQatarRomaniaRussian FederationRwandaSamoaSao Tome and PrincipeSaudi ArabiaSenegalSerbiaSeychellesSierra LeoneSingaporeSlovak RepublicSmall statesSolomon IslandsSouth AfricaSouth AsiaSouth Asia (IDA & IBRD)South SudanSri LankaSt. Kitts and NevisSt. LuciaSt. Vincent and the GrenadinesSub-Saharan Africa Sub-Saharan Africa (excluding high income)Sub-Saharan Africa (IDA & IBRD countries)SudanSurinameSwazilandSwedenSwitzerlandSyrian Arab RepublicTajikistanTanzaniaThailandTimor-LesteTogoTongaTrinidad and TobagoTunisiaTurkeyUgandaUkraineUnited Arab EmiratesUnited KingdomUnited StatesUpper middle incomeUruguayVanuatuVenezuela, RBVietnamWest Bank and GazaWorldYemen, Rep.ZambiaZimbabwe Timeline:
This timeline shows a graph from 1961 to 2016 of Middle East & North Africa. No data until 1960. Number of actual observations by date: 54.
Source name:
World Development Indicators
Source organization:
International Monetary Fund, International Financial Statistics and data files, and World Bank and OECD GDP estimates.
Categories, topics:
Financial Sector
Last updated:
apr 23, 2017
Indicators value changes by year
Minimum:
22.686
jan 1, 1961
Maximum:
82.805
jan 1, 2016
At the date of observation
Value
Absolute change
Change from previous value
jan 1, 1961
22.686
+22.686
0.0%
jan 1, 1962
23.018
+0.332
1.46%
jan 1, 1963
24.582
+1.564
6.79%
jan 1, 1964
25.524
+0.942
3.83%
jan 1, 1965
26.988
+1.464
5.74%
jan 1, 1966
30.495
+3.506
12.99%
jan 1, 1967
32.242
+1.747
5.73%
jan 1, 1968
35.43
+3.188
9.89%
jan 1, 1969
34.274
-1.157
-3.26%
jan 1, 1970
34.584
+0.31
0.91%
jan 1, 1971
34.61
+0.026
0.07%
jan 1, 1972
33.066
-1.544
-4.46%
jan 1, 1973
33.606
+0.54
1.63%
jan 1, 1974
32.588
-1.018
-3.03%
jan 1, 1975
23.611
-8.977
-27.55%
jan 1, 1976
27.566
+3.955
16.75%
jan 1, 1977
29.018
+1.453
5.27%
jan 1, 1978
31.882
+2.864
9.87%
jan 1, 1979
36.806
+4.924
15.44%
jan 1, 1980
35.154
-1.652
-4.49%
jan 1, 1981
34.051
-1.103
-3.14%
jan 1, 1982
38.886
+4.835
14.2%
jan 1, 1983
45.667
+6.781
17.44%
jan 1, 1984
51.534
+5.867
12.85%
jan 1, 1987
63.585
+12.051
23.39%
jan 1, 1988
63.695
+0.11
0.17%
jan 1, 1989
66.129
+2.434
3.82%
jan 1, 1990
62.668
-3.462
-5.23%
jan 1, 1991
55.231
-7.437
-11.87%
jan 1, 1992
56.781
+1.55
2.81%
jan 1, 1993
56.347
-0.434
-0.76%
jan 1, 1994
56.307
-0.04
-0.07%
jan 1, 1995
57.026
+0.719
1.28%
jan 1, 1996
54.65
-2.376
-4.17%
jan 1, 1997
53.055
-1.595
-2.92%
jan 1, 1998
54.403
+1.348
2.54%
jan 1, 1999
59.727
+5.323
9.79%
jan 1, 2000
58.948
-0.779
-1.3%
jan 1, 2001
56.427
-2.521
-4.28%
jan 1, 2002
62.455
+6.028
10.68%
jan 1, 2003
64.973
+2.518
4.03%
jan 1, 2004
63.976
-0.997
-1.53%
jan 1, 2005
61.037
-2.939
-4.59%
jan 1, 2006
58.547
-2.489
-4.08%
jan 1, 2007
59.623
+1.075
1.84%
jan 1, 2008
66.973
+7.35
12.33%
jan 1, 2009
64.814
-2.159
-3.22%
jan 1, 2010
78.337
+13.523
20.86%
jan 1, 2011
73.748
-4.589
-5.86%
jan 1, 2012
69.171
-4.577
-6.21%
jan 1, 2013
70.714
+1.543
2.23%
jan 1, 2014
76.025
+5.31
7.51%
jan 1, 2015
82.195
+6.17
8.12%
jan 1, 2016
82.805
+0.61
0.74%
Ranking of countries by current statistics by years


Comments: