29
/
en
AIzaSyAYiBZKx7MnpbEhh9jyipgxe19OcubqV5w
April 1, 2024
60586
Sub-Saharan Africa (IDA & IBRD countries)
TSS
false
2
1
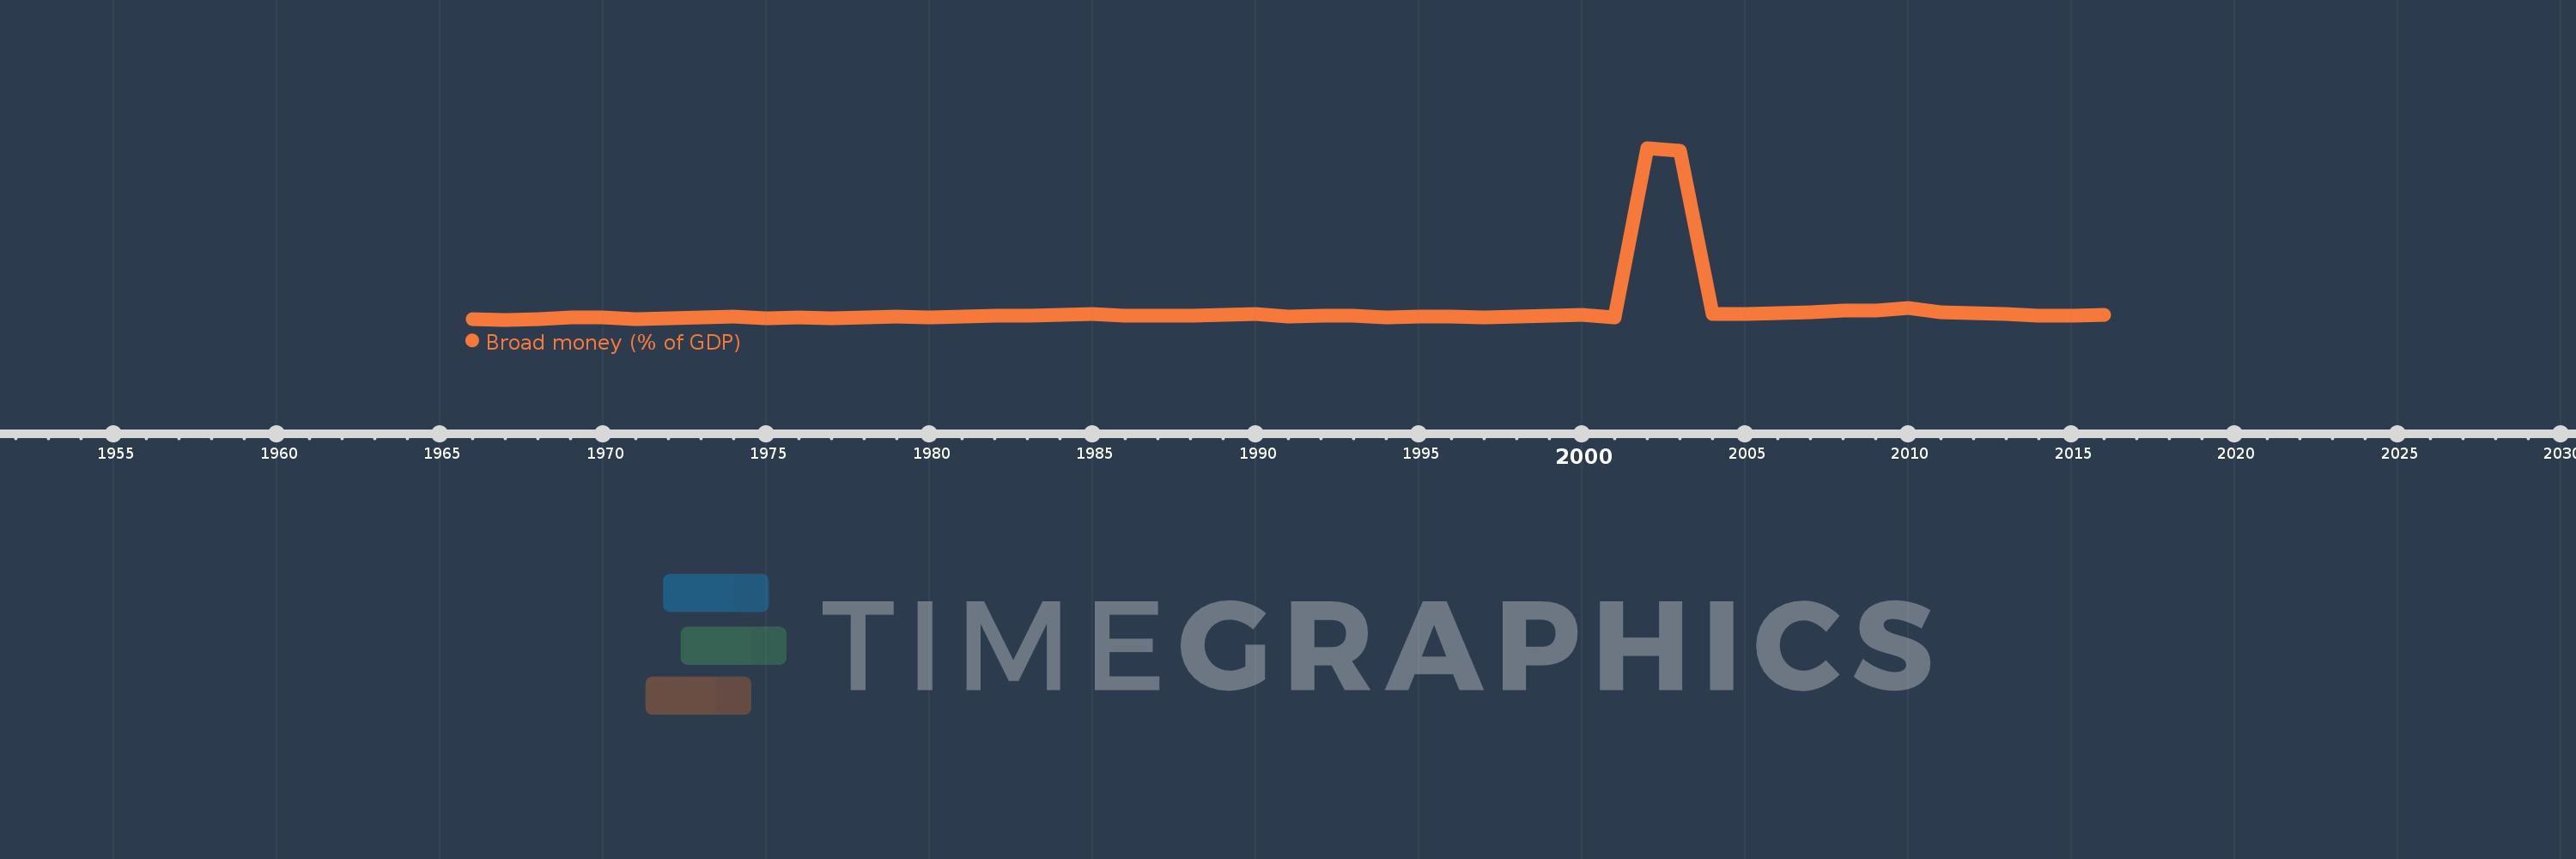
Broad money (% of GDP)
2016,2015,2014,2013,2012,2011,2010,2009,2008,2007,2006,2005,2004,2003,2002,2001,2000,1999,1998,1997,1996,1995,1994,1993,1992,1991,1990,1989,1988,1987,1986,1985,1984,1983,1982,1981,1980,1979,1978,1977,1976,1975,1974,1973,1972,1971,1970,1969,1968,1967,1966
This statistics in other country:
AfghanistanAlbaniaAlgeriaAngolaAntigua and BarbudaArab WorldArgentinaArmeniaArubaAustraliaAzerbaijanBahamas, TheBahrainBangladeshBarbadosBelarusBelizeBeninBhutanBoliviaBosnia and HerzegovinaBotswanaBrazilBrunei DarussalamBulgariaBurkina FasoBurundiCabo VerdeCambodiaCameroonCanadaCaribbean small statesCentral African RepublicCentral Europe and the BalticsChadChileChinaColombiaComorosCongo, Dem. Rep.Congo, Rep.Costa RicaCote d'IvoireCroatiaCzech RepublicDenmarkDjiboutiDominicaDominican RepublicEarly-demographic dividendEast Asia & PacificEast Asia & Pacific (excluding high income)East Asia & Pacific (IDA & IBRD countries)EcuadorEgypt, Arab Rep.El SalvadorEquatorial GuineaEritreaEstoniaEthiopiaEurope & Central Asia (excluding high income)Europe & Central Asia (IDA & IBRD countries)FijiFragile and conflict affected situationsGabonGambia, TheGeorgiaGhanaGrenadaGuatemalaGuineaGuinea-BissauGuyanaHaitiHeavily indebted poor countries (HIPC)High incomeHondurasHong Kong SAR, ChinaHungaryIBRD onlyIcelandIDA & IBRD totalIDA blendIDA onlyIDA totalIndiaIndonesiaIran, Islamic Rep.IraqIsraelJamaicaJapanJordanKazakhstanKenyaKorea, Rep.KuwaitKyrgyz RepublicLao PDRLate-demographic dividendLatin America & Caribbean Latin America & Caribbean (excluding high income)Latin America & the Caribbean (IDA & IBRD countries)LatviaLeast developed countries: UN classificationLebanonLesothoLiberiaLibyaLithuaniaLow & middle incomeLow incomeLower middle incomeMacao SAR, ChinaMacedonia, FYRMadagascarMalawiMalaysiaMaldivesMaliMauritaniaMauritiusMexicoMicronesia, Fed. Sts.Middle East & North AfricaMiddle East & North Africa (excluding high income)Middle East & North Africa (IDA & IBRD countries)Middle incomeMoldovaMongoliaMoroccoMozambiqueMyanmarNamibiaNepalNew ZealandNicaraguaNigerNigeriaNorth AmericaNorwayOECD membersOmanOther small statesPacific island small statesPakistanPanamaPapua New GuineaParaguayPeruPhilippinesPolandPost-demographic dividendPre-demographic dividendQatarRomaniaRussian FederationRwandaSamoaSao Tome and PrincipeSaudi ArabiaSenegalSerbiaSeychellesSierra LeoneSingaporeSlovak RepublicSmall statesSolomon IslandsSouth AfricaSouth AsiaSouth Asia (IDA & IBRD)South SudanSri LankaSt. Kitts and NevisSt. LuciaSt. Vincent and the GrenadinesSub-Saharan Africa Sub-Saharan Africa (excluding high income)Sub-Saharan Africa (IDA & IBRD countries)SudanSurinameSwazilandSwedenSwitzerlandSyrian Arab RepublicTajikistanTanzaniaThailandTimor-LesteTogoTongaTrinidad and TobagoTunisiaTurkeyUgandaUkraineUnited Arab EmiratesUnited KingdomUnited StatesUpper middle incomeUruguayVanuatuVenezuela, RBVietnamWest Bank and GazaWorldYemen, Rep.ZambiaZimbabwe Timeline:
This timeline shows a graph from 1966 to 2016 of Sub-Saharan Africa (IDA & IBRD countries). No data until 1965. Number of actual observations by date: 51.
Source name:
World Development Indicators
Source organization:
International Monetary Fund, International Financial Statistics and data files, and World Bank and OECD GDP estimates.
Categories, topics:
Financial Sector
Last updated:
apr 23, 2017
Indicators value changes by year
Maximum:
254.265
jan 1, 2002
At the date of observation
Value
Absolute change
Change from previous value
jan 1, 1966
31.362
+31.362
0.0%
jan 1, 1967
30.97
-0.392
-1.25%
jan 1, 1968
31.989
+1.019
3.29%
jan 1, 1969
34.051
+2.062
6.45%
jan 1, 1970
34.107
+0.056
0.16%
jan 1, 1971
31.9
-2.207
-6.47%
jan 1, 1972
33.338
+1.439
4.51%
jan 1, 1973
33.45
+0.111
0.33%
jan 1, 1974
34.792
+1.342
4.01%
jan 1, 1975
32.778
-2.014
-5.79%
jan 1, 1976
34.446
+1.668
5.09%
jan 1, 1977
33.061
-1.385
-4.02%
jan 1, 1978
34.449
+1.388
4.2%
jan 1, 1979
34.926
+0.477
1.39%
jan 1, 1980
34.183
-0.743
-2.13%
jan 1, 1981
35.446
+1.263
3.69%
jan 1, 1982
35.925
+0.479
1.35%
jan 1, 1983
36.219
+0.295
0.82%
jan 1, 1984
37.262
+1.042
2.88%
jan 1, 1985
38.246
+0.985
2.64%
jan 1, 1986
36.611
-1.635
-4.28%
jan 1, 1987
35.757
-0.854
-2.33%
jan 1, 1988
36.481
+0.724
2.02%
jan 1, 1989
37.585
+1.105
3.03%
jan 1, 1990
38.105
+0.52
1.38%
jan 1, 1991
35.092
-3.013
-7.91%
jan 1, 1992
36.219
+1.127
3.21%
jan 1, 1993
36.056
-0.162
-0.45%
jan 1, 1994
34.147
-1.91
-5.3%
jan 1, 1995
35.413
+1.266
3.71%
jan 1, 1996
34.62
-0.793
-2.24%
jan 1, 1997
33.747
-0.873
-2.52%
jan 1, 1998
35.403
+1.656
4.91%
jan 1, 1999
36.168
+0.765
2.16%
jan 1, 2000
36.825
+0.657
1.82%
jan 1, 2001
33.445
-3.38
-9.18%
jan 1, 2002
254.265
+220.82
660.24%
jan 1, 2003
250.814
-3.451
-1.36%
jan 1, 2004
38.665
-212.148
-84.58%
jan 1, 2005
38.795
+0.13
0.34%
jan 1, 2006
39.847
+1.052
2.71%
jan 1, 2007
40.454
+0.607
1.52%
jan 1, 2008
43.434
+2.98
7.37%
jan 1, 2009
43.141
-0.293
-0.67%
jan 1, 2010
46.699
+3.559
8.25%
jan 1, 2011
40.74
-5.959
-12.76%
jan 1, 2012
40.026
-0.714
-1.75%
jan 1, 2013
38.419
-1.607
-4.02%
jan 1, 2014
36.589
-1.83
-4.76%
jan 1, 2015
35.78
-0.809
-2.21%
jan 1, 2016
37.49
+1.71
4.78%
Ranking of countries by current statistics by years


Comments: