29
/
en
AIzaSyAYiBZKx7MnpbEhh9jyipgxe19OcubqV5w
April 1, 2024
271930
Uganda
UGA
true
2
1
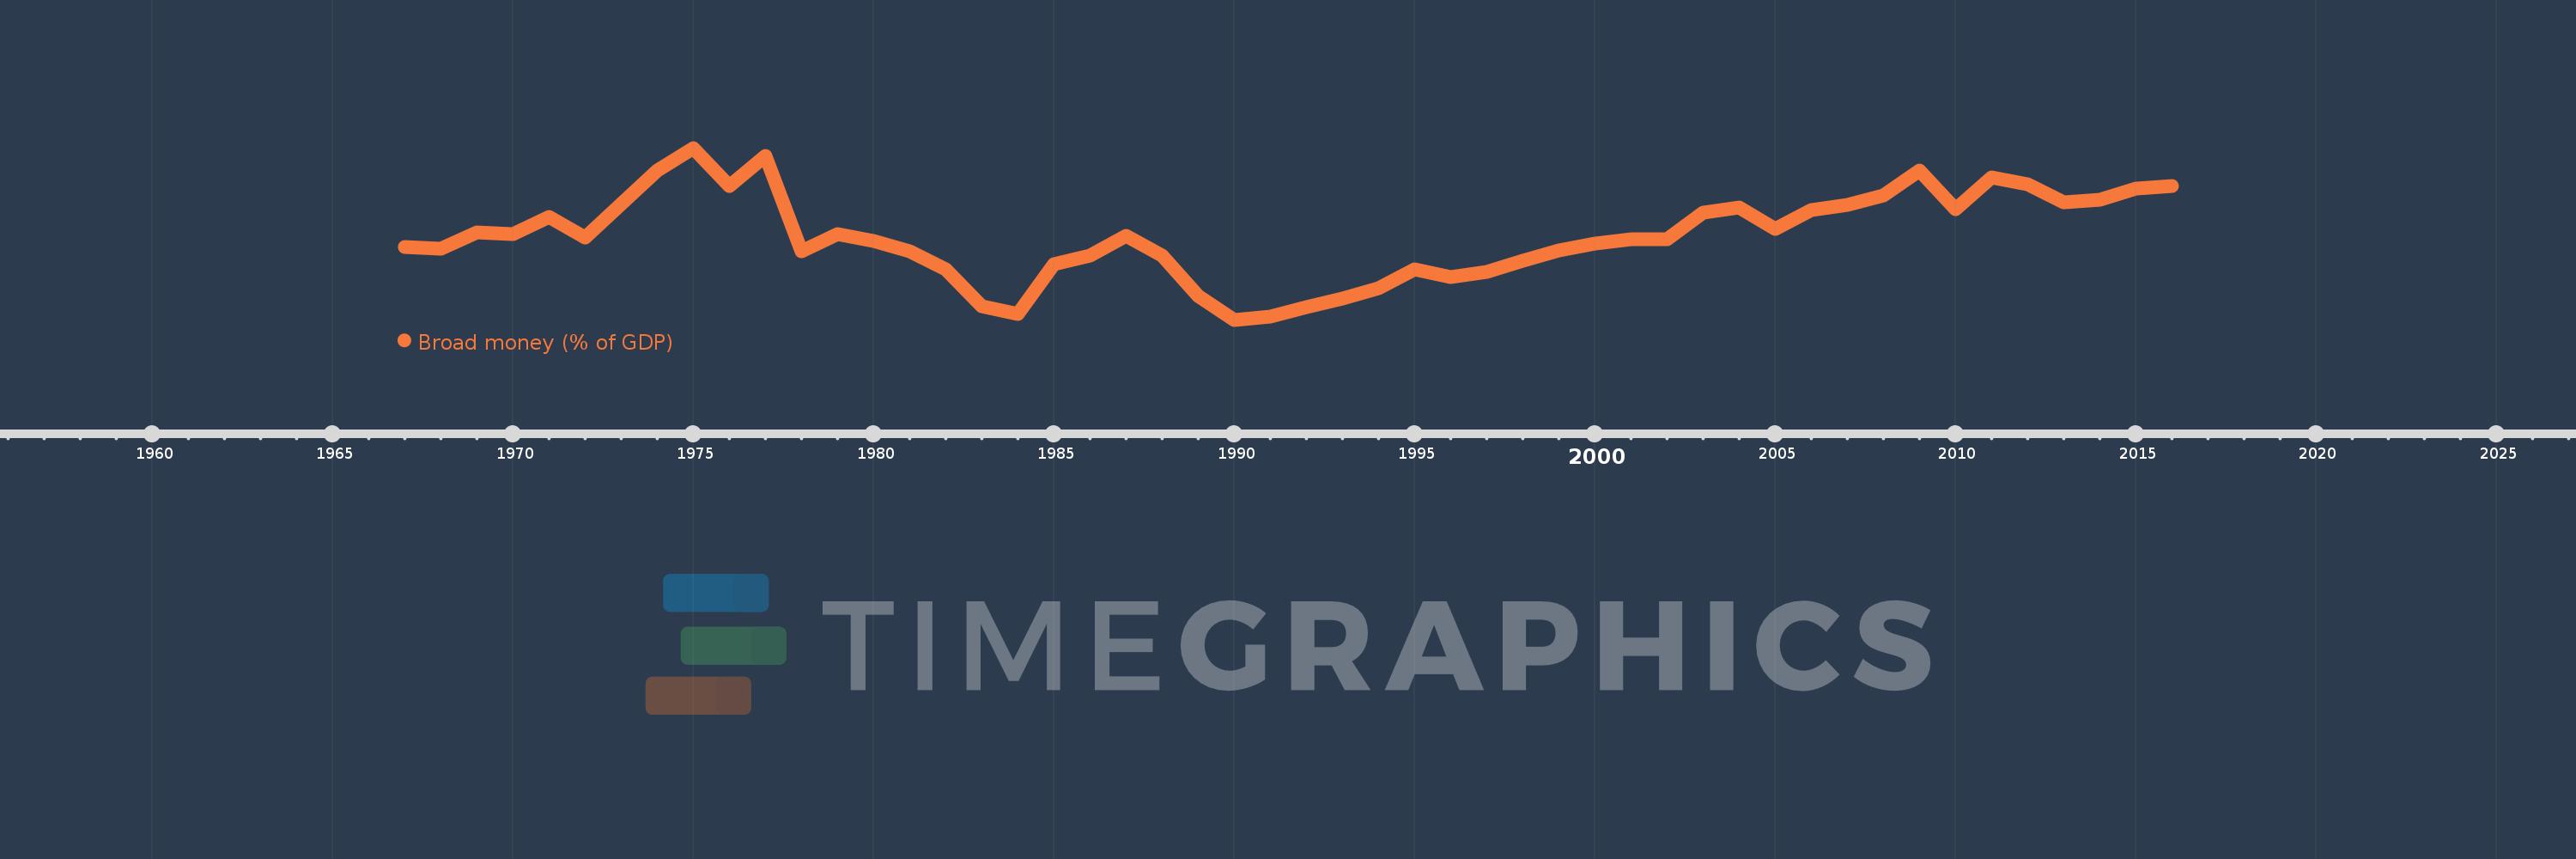
Broad money (% of GDP)
2016,2015,2014,2013,2012,2011,2010,2009,2008,2007,2006,2005,2004,2003,2002,2001,2000,1999,1998,1997,1996,1995,1994,1993,1992,1991,1990,1989,1988,1987,1986,1985,1984,1983,1982,1981,1980,1979,1978,1977,1976,1975,1974,1973,1972,1971,1970,1969,1968,1967
This statistics in other country:
AfghanistanAlbaniaAlgeriaAngolaAntigua and BarbudaArab WorldArgentinaArmeniaArubaAustraliaAzerbaijanBahamas, TheBahrainBangladeshBarbadosBelarusBelizeBeninBhutanBoliviaBosnia and HerzegovinaBotswanaBrazilBrunei DarussalamBulgariaBurkina FasoBurundiCabo VerdeCambodiaCameroonCanadaCaribbean small statesCentral African RepublicCentral Europe and the BalticsChadChileChinaColombiaComorosCongo, Dem. Rep.Congo, Rep.Costa RicaCote d'IvoireCroatiaCzech RepublicDenmarkDjiboutiDominicaDominican RepublicEarly-demographic dividendEast Asia & PacificEast Asia & Pacific (excluding high income)East Asia & Pacific (IDA & IBRD countries)EcuadorEgypt, Arab Rep.El SalvadorEquatorial GuineaEritreaEstoniaEthiopiaEurope & Central Asia (excluding high income)Europe & Central Asia (IDA & IBRD countries)FijiFragile and conflict affected situationsGabonGambia, TheGeorgiaGhanaGrenadaGuatemalaGuineaGuinea-BissauGuyanaHaitiHeavily indebted poor countries (HIPC)High incomeHondurasHong Kong SAR, ChinaHungaryIBRD onlyIcelandIDA & IBRD totalIDA blendIDA onlyIDA totalIndiaIndonesiaIran, Islamic Rep.IraqIsraelJamaicaJapanJordanKazakhstanKenyaKorea, Rep.KuwaitKyrgyz RepublicLao PDRLate-demographic dividendLatin America & Caribbean Latin America & Caribbean (excluding high income)Latin America & the Caribbean (IDA & IBRD countries)LatviaLeast developed countries: UN classificationLebanonLesothoLiberiaLibyaLithuaniaLow & middle incomeLow incomeLower middle incomeMacao SAR, ChinaMacedonia, FYRMadagascarMalawiMalaysiaMaldivesMaliMauritaniaMauritiusMexicoMicronesia, Fed. Sts.Middle East & North AfricaMiddle East & North Africa (excluding high income)Middle East & North Africa (IDA & IBRD countries)Middle incomeMoldovaMongoliaMoroccoMozambiqueMyanmarNamibiaNepalNew ZealandNicaraguaNigerNigeriaNorth AmericaNorwayOECD membersOmanOther small statesPacific island small statesPakistanPanamaPapua New GuineaParaguayPeruPhilippinesPolandPost-demographic dividendPre-demographic dividendQatarRomaniaRussian FederationRwandaSamoaSao Tome and PrincipeSaudi ArabiaSenegalSerbiaSeychellesSierra LeoneSingaporeSlovak RepublicSmall statesSolomon IslandsSouth AfricaSouth AsiaSouth Asia (IDA & IBRD)South SudanSri LankaSt. Kitts and NevisSt. LuciaSt. Vincent and the GrenadinesSub-Saharan Africa Sub-Saharan Africa (excluding high income)Sub-Saharan Africa (IDA & IBRD countries)SudanSurinameSwazilandSwedenSwitzerlandSyrian Arab RepublicTajikistanTanzaniaThailandTimor-LesteTogoTongaTrinidad and TobagoTunisiaTurkeyUgandaUkraineUnited Arab EmiratesUnited KingdomUnited StatesUpper middle incomeUruguayVanuatuVenezuela, RBVietnamWest Bank and GazaWorldYemen, Rep.ZambiaZimbabwe Timeline:
This timeline shows a graph from 1967 to 2016 of Uganda. No data until 1966. Number of actual observations by date: 50.
Source name:
World Development Indicators
Source organization:
International Monetary Fund, International Financial Statistics and data files, and World Bank and OECD GDP estimates.
Categories, topics:
Financial Sector
Last updated:
apr 23, 2017
Indicators value changes by year
Maximum:
26.128
jan 1, 1975
At the date of observation
Value
Absolute change
Change from previous value
jan 1, 1967
15.28
+15.28
0.0%
jan 1, 1968
15.09
-0.189
-1.24%
jan 1, 1969
16.884
+1.794
11.89%
jan 1, 1970
16.726
-0.158
-0.94%
jan 1, 1971
18.554
+1.828
10.93%
jan 1, 1972
16.3
-2.254
-12.15%
jan 1, 1973
19.965
+3.666
22.49%
jan 1, 1974
23.634
+3.668
18.37%
jan 1, 1975
26.128
+2.495
10.56%
jan 1, 1976
21.944
-4.184
-16.01%
jan 1, 1977
25.274
+3.33
15.17%
jan 1, 1978
14.792
-10.481
-41.47%
jan 1, 1979
16.653
+1.861
12.58%
jan 1, 1980
15.926
-0.727
-4.36%
jan 1, 1981
14.76
-1.166
-7.32%
jan 1, 1982
12.773
-1.987
-13.46%
jan 1, 1983
8.746
-4.027
-31.53%
jan 1, 1984
7.936
-0.81
-9.26%
jan 1, 1985
13.395
+5.46
68.8%
jan 1, 1986
14.299
+0.904
6.75%
jan 1, 1987
16.473
+2.174
15.21%
jan 1, 1988
14.289
-2.184
-13.26%
jan 1, 1989
9.907
-4.382
-30.67%
jan 1, 1990
7.288
-2.619
-26.44%
jan 1, 1991
7.597
+0.309
4.24%
jan 1, 1992
8.661
+1.065
14.02%
jan 1, 1993
9.612
+0.95
10.97%
jan 1, 1994
10.719
+1.108
11.52%
jan 1, 1995
12.805
+2.085
19.45%
jan 1, 1996
11.961
-0.844
-6.59%
jan 1, 1997
12.515
+0.554
4.64%
jan 1, 1998
13.793
+1.278
10.21%
jan 1, 1999
14.859
+1.065
7.72%
jan 1, 2000
15.634
+0.775
5.21%
jan 1, 2001
16.116
+0.482
3.08%
jan 1, 2002
16.091
-0.024
-0.15%
jan 1, 2003
19.032
+2.941
18.27%
jan 1, 2004
19.554
+0.522
2.74%
jan 1, 2005
17.228
-2.325
-11.89%
jan 1, 2006
19.323
+2.094
12.16%
jan 1, 2007
19.914
+0.591
3.06%
jan 1, 2008
20.875
+0.961
4.83%
jan 1, 2009
23.618
+2.742
13.14%
jan 1, 2010
19.395
-4.223
-17.88%
jan 1, 2011
22.919
+3.524
18.17%
jan 1, 2012
22.183
-0.736
-3.21%
jan 1, 2013
20.169
-2.014
-9.08%
jan 1, 2014
20.493
+0.324
1.61%
jan 1, 2015
21.696
+1.203
5.87%
jan 1, 2016
21.928
+0.232
1.07%
Ranking of countries by current statistics by years


Comments: