29
/
en
AIzaSyAYiBZKx7MnpbEhh9jyipgxe19OcubqV5w
April 1, 2024
264280
Togo
TGO
true
2
1
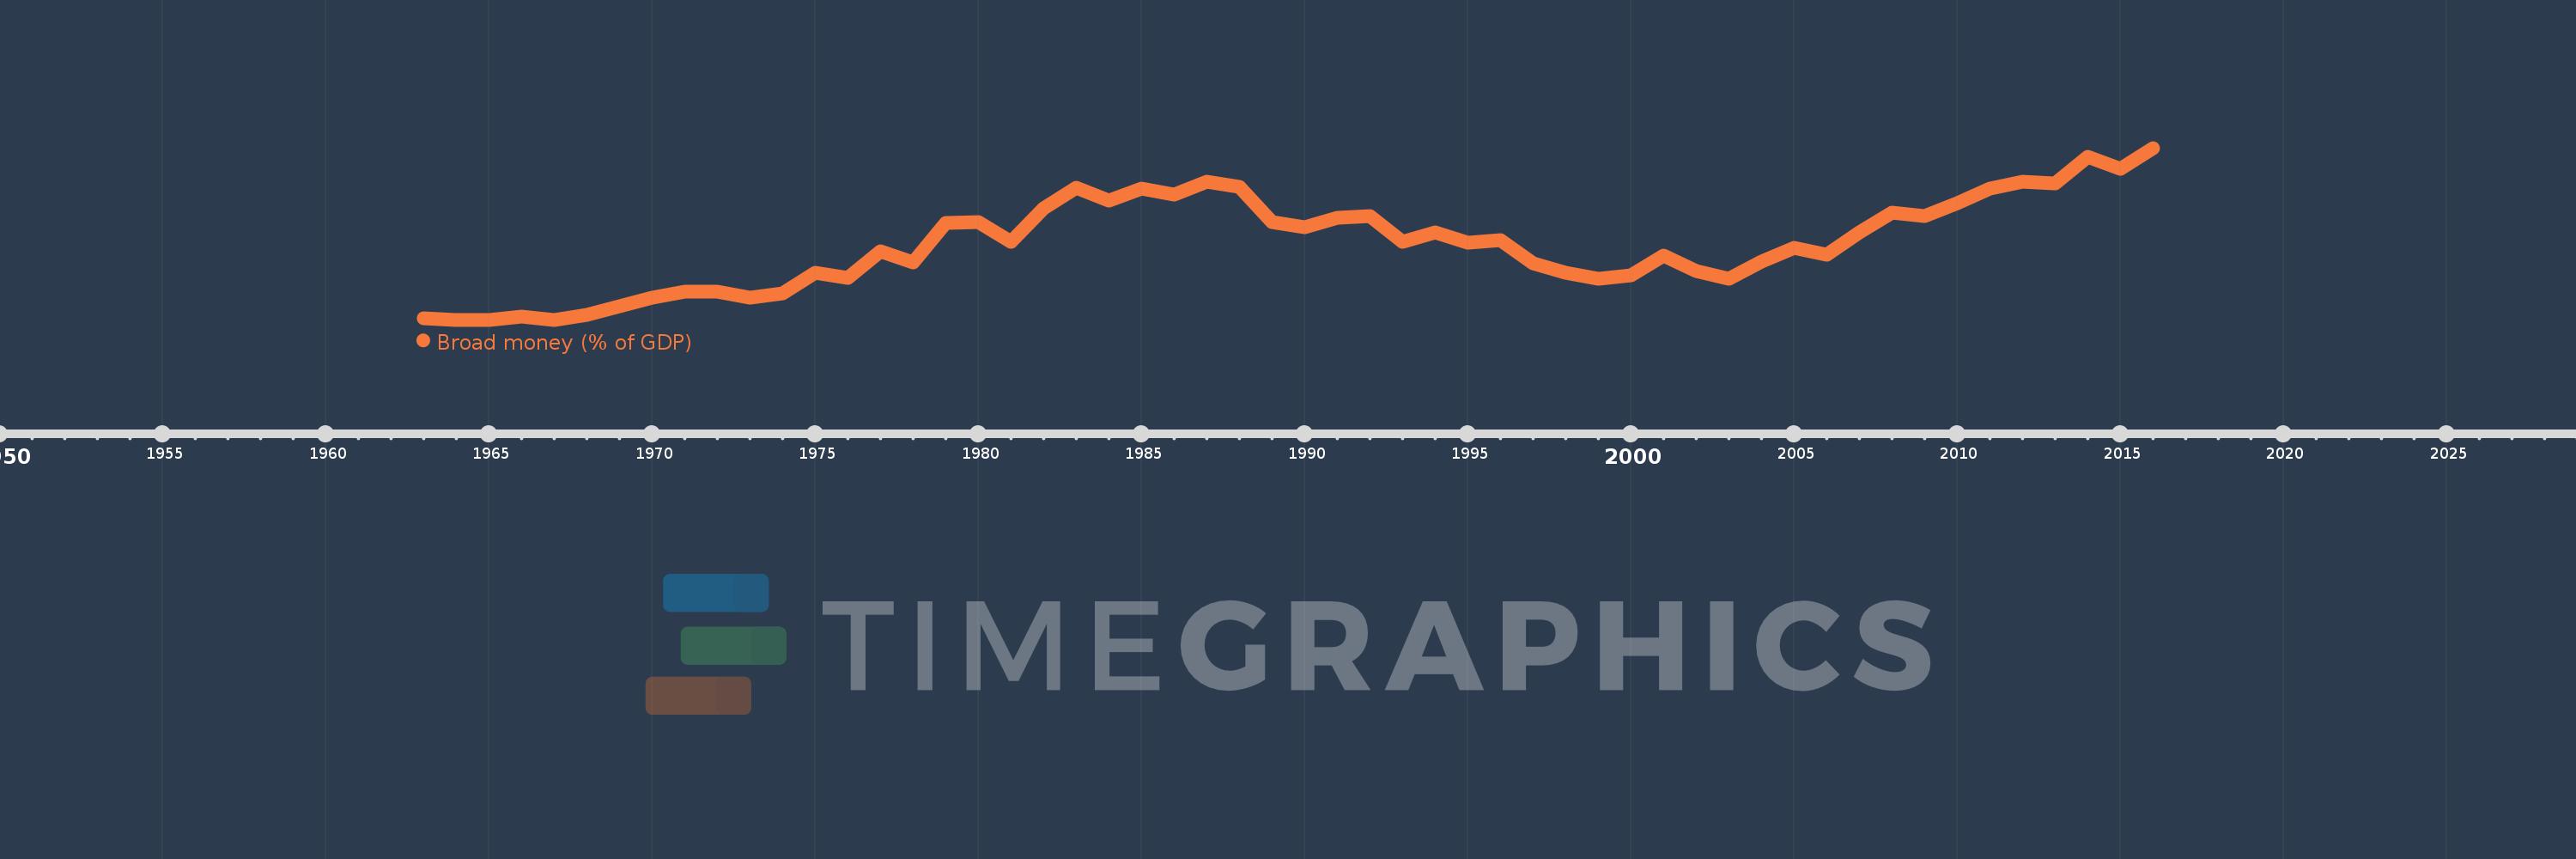
Broad money (% of GDP)
2016,2015,2014,2013,2012,2011,2010,2009,2008,2007,2006,2005,2004,2003,2002,2001,2000,1999,1998,1997,1996,1995,1994,1993,1992,1991,1990,1989,1988,1987,1986,1985,1984,1983,1982,1981,1980,1979,1978,1977,1976,1975,1974,1973,1972,1971,1970,1969,1968,1967,1966,1965,1964,1963
This statistics in other country:
AfghanistanAlbaniaAlgeriaAngolaAntigua and BarbudaArab WorldArgentinaArmeniaArubaAustraliaAzerbaijanBahamas, TheBahrainBangladeshBarbadosBelarusBelizeBeninBhutanBoliviaBosnia and HerzegovinaBotswanaBrazilBrunei DarussalamBulgariaBurkina FasoBurundiCabo VerdeCambodiaCameroonCanadaCaribbean small statesCentral African RepublicCentral Europe and the BalticsChadChileChinaColombiaComorosCongo, Dem. Rep.Congo, Rep.Costa RicaCote d'IvoireCroatiaCzech RepublicDenmarkDjiboutiDominicaDominican RepublicEarly-demographic dividendEast Asia & PacificEast Asia & Pacific (excluding high income)East Asia & Pacific (IDA & IBRD countries)EcuadorEgypt, Arab Rep.El SalvadorEquatorial GuineaEritreaEstoniaEthiopiaEurope & Central Asia (excluding high income)Europe & Central Asia (IDA & IBRD countries)FijiFragile and conflict affected situationsGabonGambia, TheGeorgiaGhanaGrenadaGuatemalaGuineaGuinea-BissauGuyanaHaitiHeavily indebted poor countries (HIPC)High incomeHondurasHong Kong SAR, ChinaHungaryIBRD onlyIcelandIDA & IBRD totalIDA blendIDA onlyIDA totalIndiaIndonesiaIran, Islamic Rep.IraqIsraelJamaicaJapanJordanKazakhstanKenyaKorea, Rep.KuwaitKyrgyz RepublicLao PDRLate-demographic dividendLatin America & Caribbean Latin America & Caribbean (excluding high income)Latin America & the Caribbean (IDA & IBRD countries)LatviaLeast developed countries: UN classificationLebanonLesothoLiberiaLibyaLithuaniaLow & middle incomeLow incomeLower middle incomeMacao SAR, ChinaMacedonia, FYRMadagascarMalawiMalaysiaMaldivesMaliMauritaniaMauritiusMexicoMicronesia, Fed. Sts.Middle East & North AfricaMiddle East & North Africa (excluding high income)Middle East & North Africa (IDA & IBRD countries)Middle incomeMoldovaMongoliaMoroccoMozambiqueMyanmarNamibiaNepalNew ZealandNicaraguaNigerNigeriaNorth AmericaNorwayOECD membersOmanOther small statesPacific island small statesPakistanPanamaPapua New GuineaParaguayPeruPhilippinesPolandPost-demographic dividendPre-demographic dividendQatarRomaniaRussian FederationRwandaSamoaSao Tome and PrincipeSaudi ArabiaSenegalSerbiaSeychellesSierra LeoneSingaporeSlovak RepublicSmall statesSolomon IslandsSouth AfricaSouth AsiaSouth Asia (IDA & IBRD)South SudanSri LankaSt. Kitts and NevisSt. LuciaSt. Vincent and the GrenadinesSub-Saharan Africa Sub-Saharan Africa (excluding high income)Sub-Saharan Africa (IDA & IBRD countries)SudanSurinameSwazilandSwedenSwitzerlandSyrian Arab RepublicTajikistanTanzaniaThailandTimor-LesteTogoTongaTrinidad and TobagoTunisiaTurkeyUgandaUkraineUnited Arab EmiratesUnited KingdomUnited StatesUpper middle incomeUruguayVanuatuVenezuela, RBVietnamWest Bank and GazaWorldYemen, Rep.ZambiaZimbabwe Timeline:
This timeline shows a graph from 1963 to 2016 of Togo. No data until 1962. Number of actual observations by date: 54.
Source name:
World Development Indicators
Source organization:
International Monetary Fund, International Financial Statistics and data files, and World Bank and OECD GDP estimates.
Categories, topics:
Financial Sector
Last updated:
apr 23, 2017
Indicators value changes by year
Minimum:
11.092
jan 1, 1967
Maximum:
53.234
jan 1, 2016
At the date of observation
Value
Absolute change
Change from previous value
jan 1, 1963
11.358
+11.358
0.0%
jan 1, 1964
11.111
-0.247
-2.17%
jan 1, 1965
11.13
+0.019
0.17%
jan 1, 1966
11.874
+0.743
6.68%
jan 1, 1967
11.092
-0.781
-6.58%
jan 1, 1968
12.228
+1.136
10.24%
jan 1, 1969
14.295
+2.067
16.91%
jan 1, 1970
16.51
+2.215
15.49%
jan 1, 1971
18.063
+1.553
9.4%
jan 1, 1972
17.886
-0.177
-0.98%
jan 1, 1973
16.429
-1.457
-8.15%
jan 1, 1974
17.565
+1.136
6.91%
jan 1, 1975
22.586
+5.02
28.58%
jan 1, 1976
21.374
-1.211
-5.36%
jan 1, 1977
27.845
+6.471
30.28%
jan 1, 1978
25.172
-2.674
-9.6%
jan 1, 1979
34.916
+9.744
38.71%
jan 1, 1980
35.074
+0.158
0.45%
jan 1, 1981
30.225
-4.849
-13.82%
jan 1, 1982
38.459
+8.234
27.24%
jan 1, 1983
43.397
+4.938
12.84%
jan 1, 1984
40.357
-3.04
-7.0%
jan 1, 1985
43.364
+3.007
7.45%
jan 1, 1986
41.81
-1.554
-3.58%
jan 1, 1987
45.043
+3.233
7.73%
jan 1, 1988
43.638
-1.405
-3.12%
jan 1, 1989
35.138
-8.5
-19.48%
jan 1, 1990
33.81
-1.328
-3.78%
jan 1, 1991
36.05
+2.24
6.63%
jan 1, 1992
36.471
+0.421
1.17%
jan 1, 1993
30.166
-6.305
-17.29%
jan 1, 1994
32.437
+2.271
7.53%
jan 1, 1995
29.964
-2.472
-7.62%
jan 1, 1996
30.583
+0.619
2.07%
jan 1, 1997
24.971
-5.613
-18.35%
jan 1, 1998
22.522
-2.449
-9.81%
jan 1, 1999
21.055
-1.467
-6.51%
jan 1, 2000
22.021
+0.966
4.59%
jan 1, 2001
26.754
+4.733
21.49%
jan 1, 2002
22.955
-3.799
-14.2%
jan 1, 2003
21.227
-1.728
-7.53%
jan 1, 2004
25.404
+4.177
19.68%
jan 1, 2005
28.787
+3.384
13.32%
jan 1, 2006
27.085
-1.702
-5.91%
jan 1, 2007
32.43
+5.344
19.73%
jan 1, 2008
37.394
+4.964
15.31%
jan 1, 2009
36.464
-0.93
-2.49%
jan 1, 2010
39.613
+3.149
8.64%
jan 1, 2011
43.25
+3.637
9.18%
jan 1, 2012
45.003
+1.752
4.05%
jan 1, 2013
44.545
-0.457
-1.02%
jan 1, 2014
51.102
+6.556
14.72%
jan 1, 2015
48.188
-2.913
-5.7%
jan 1, 2016
53.234
+5.046
10.47%
Ranking of countries by current statistics by years


Comments: